

Adam Eagleston, CFA
Chief Investment Officer
It’s hard to decide which is generating more enthusiasm at present: AI stocks or the FIFA World Cup. The latter we know ends soon; we will explore whether the former can persist in this quarter’s update and how we are thinking about positioning client portfolios.
Key Takeaways:
It’s all here – fast-kicking, low scoring, and ties? You bet!
- Unlike the stereotypical soccer match, stocks were anything but low scoring in Q2, with the S&P 500 posting its best quarter since the post-Covid bounce in Q2 2020.
- “Cooling” tensions with Iran (let’s call it a tie), which lowered oil prices (and inflation expectations) coupled with strong earnings growth for AI stocks fueled the rally.
- Despite the index being near all-time highs, only a small sub-set of more speculative stocks is outperforming.
Halfback passes to the center. Back to the wing. Back to the center. Center holds it.
- As we have discussed in prior newsletters, circular financing, cross-ownership, and accounting gimmicks are fueling parts of the rally.
- Index concentration in a few AI-adjacent sectors is at record levels.
- Despite some warning signs, stock market momentum has historically persisted after these types of outsized gains.
Ach! They call this a soccer riot?
- While some are calling this an AI bubble, valuation would not make that appear to be the case, at least if we look at forward P/E ratios.
- However, the earnings part of the P/E equation could be a source of consternation going forward.
- Portfolio construction should consider diversification at the sector and industry level in addition to valuations and earnings growth.
Before you close the email, please know these three things:
- 1Only 15% of stocks in the S&P 500 outperformed in Q2; over the past twelve months, only 6% outperformed, the lowest percentage we can remember.
- 2The best performing stocks year-to-date were among the most speculative: high beta momentum, unprofitable technology, the most shorted, and those with the weakest balance sheets are each up over 30%.
- 3Despite speculation, stretched valuations, and optimistic earnings expectations, as the FT states, “If the Fed under new chair Kevin Warsh continues to stay ‘behind the curve,’ this provides scope for the bull market to continue in the short term.”
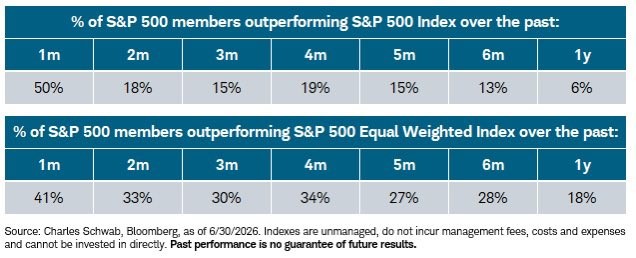
Source: Charles Schwab, Bloomberg (as of June 30, 2026)
Q2 2026 Recap: “It’s all here – fast-kicking, low scoring, and ties? You bet!”
Before we get into the Venn diagram overlap of two of my favorite things (soccer and The Simpsons) we would be remiss to overlook the 250th anniversary of the Declaration of Independence. Our colleagues in Florida wrote this piece, which links the American revolution with another product of 1776, and another of my favorites, Adam Smith’s Wealth of Nations.
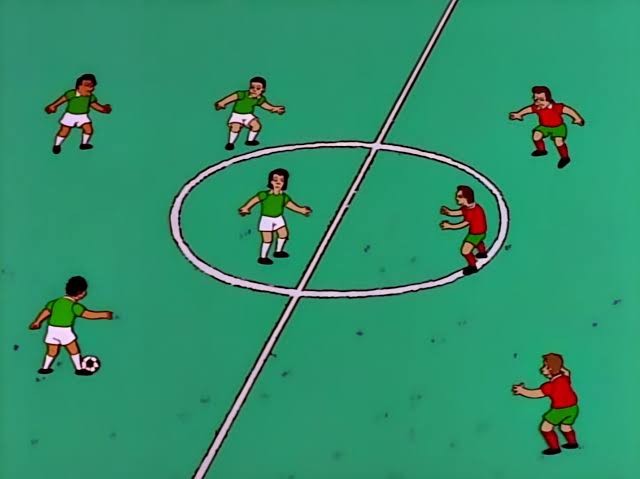
Markets benefited from some fast kicking to start the quarter. Specifically, kicking the can down the road with Iran, with a ceasefire formally announced on April 8th, effectively ended the conflict in a tie. This allowed oil prices to soften, and stocks rallied ferociously, ending Q2 with a nearly 15% gain on the S&P 500, its best quarter since Q2 2020, which was the post-Covid bounce.
| Fund/Index | 3-Month | YTD | 1-Year |
|---|---|---|---|
| S&P 500 INDEX | 14.87 | 9.55 | 20.86 |
| Invesco S&P 500 Equal Weight E | 11.29 | 11.92 | 18.84 |
| Russell 2000 Index | 21.15 | 21.86 | 39.05 |
| NASDAQ Composite Index | 21.41 | 12.79 | 28.69 |
| MSCI EAFE Index | 8.63 | 9.88 | 19.97 |
| MSCI Emerging Markets Index | 21.08 | 25.68 | 44.12 |
| Bloomberg US Treasury Total Re | 0.71 | 0.74 | 3.74 |
| Bloomberg US Agg Total Return | 0.84 | 1.02 | 2.36 |
| Invesco DB Commodity Index Tra | -7.91 | 19.23 | 25.65 |
Source: FactSet (as of most recent month end)
However, as mentioned in the intro, we cannot recall a narrower market. Only 13% of stocks in the S&P 500 have outperformed year-to-date. Only two (2) of the 11 sectors outperformed in Q2: Information Technology and Industrials, both of which are heavily exposed to the AI buildout. Also making life difficult for more serious investors is that highly speculative stocks are roaring.
The best factors year-to-date have been:
- High beta momentum – +61%
- Non-profitable tech – +47%
- Most short – +41%
- Weak balance sheet – +30%
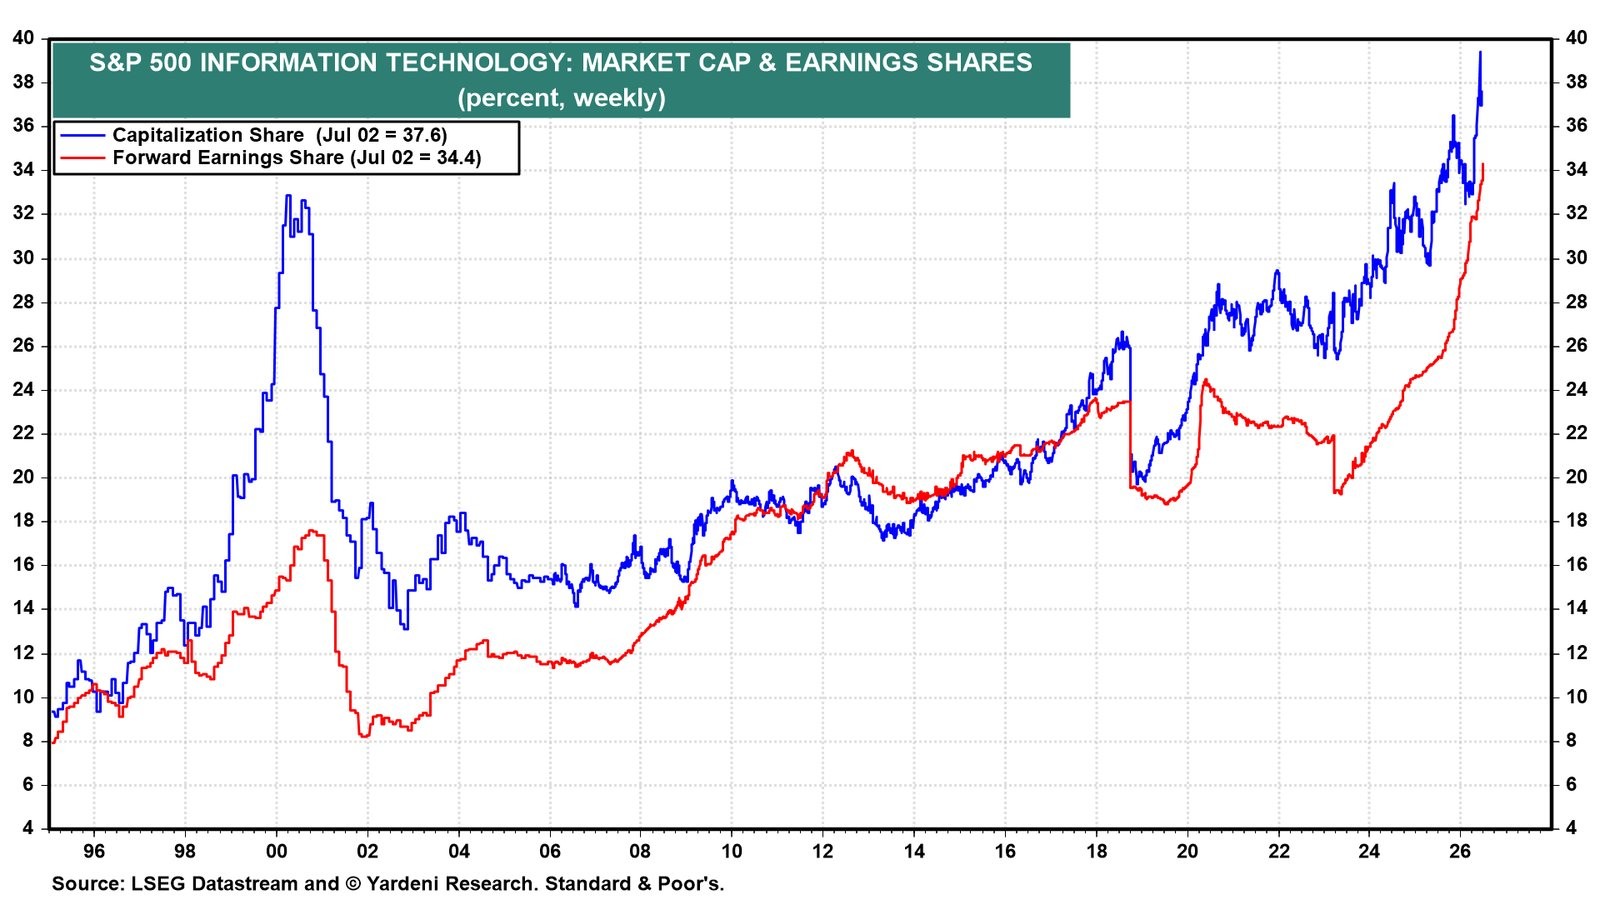
This narrow performance is driving the index to concentrations never before seen. The Information Technology sector alone is 38% of the S&P 500 (and remember, this excludes Meta and Google, which, if added, would bring the weight close to 50%). J.P. Morgan estimates the index’s weight in AI stocks at around 51%. Semiconductors, which have been the best performing industry within tech, are almost 20% of the index’s weight; they topped out at 8% during the tech bubble. In fairness, a great deal of this growth has been driven by earnings (the red line below); we will have more on this topic later, but, taken at face value, the rise in weight (the blue line) makes some logical sense:
Given all the talk of the Magnificent Seven stocks contributing to the narrowness of the market in 2025, it seems paradoxical that they have lagged in another narrow year, but that is the case. In fact, the Mag Seven is so out of favor that the source we have historically used to track their performance switched to the “Neural Nine,” adding Micron and Broadcom for some more zest. Regardless, year-to-date, only Alphabet outperformed the S&P 500, gaining 14%. Tesla (-6%), Meta (-15%), and Microsoft (-23%) are all negative.
Q3 and 2026 Outlook: “Halfback passes to the center. Back to the wing. Back to the center. Center holds it.”
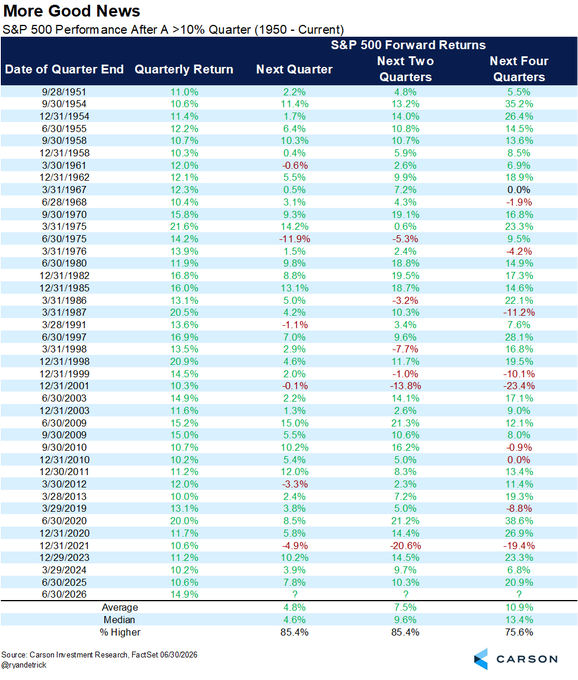
First, something that will make you as excited as the second announcer here. As mentioned, the 15% gain for Q2 is in rarified air. Aside from the aforementioned Q2 2020 bounce, you have to go all the way back to 2009 (after the GFC) to find a better quarter. Historically, double-digit gains are followed by more gains. Not only is the frequency high (the next quarter is positive 85% of the time; the next year is positive 75% of the time), but the magnitude is relatively strong (average gain of 5% next quarter and 10% next year). There are exceptions, with Q4 2021 and the late 90s/early 2000s seeing large declines as these were more like blow-off tops.
What seems most likely to determine which way we go from here are earnings, specifically in the tech sector. As mentioned previously, the companies that are supplying chips, power, etc. to the AI buildout are producing massive earnings. Currently, analysts are expecting this abnormally high growth rate to not only persist but to accelerate. Per the FT, “Analysts are now forecasting a 25 per cent increase in S&P 500 company earnings for the coming year, according to Bloomberg data, boosted by a resilient US economy and the AI boom.”
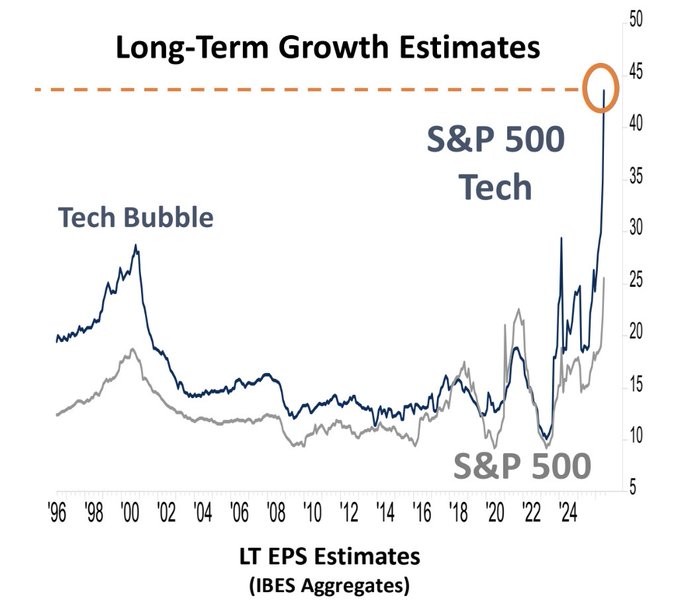
Which brings us to almost no one’s favorite topic – accounting. We will set aside the parabolic nature of these expectations and focus on two other matters that have to do with the sustainability, and reality, of these earnings. We have written about the circular (some may say incestuous) nature of the interconnectedness of many companies in the AI ecosystem.
Something we have not previously discussed is the effect of cross-ownership among these companies. What we witnessed in Q2 was a material impact on earnings for several companies (specifically Alphabet, Amazon, and Nvidia). Each of these companies was able to “mark up” the value of its holdings in private holdings, e.g., Anthropic, SpaceX, OpenAI, to reflect the “fair value” of these investments. While appropriate from a GAAP accounting perspective, these are paper profits that meaningfully affected earnings not just for these companies but for the index as a whole. With almost $70 billion in gains, this boosted total S&P earnings by between 10% and 12%.
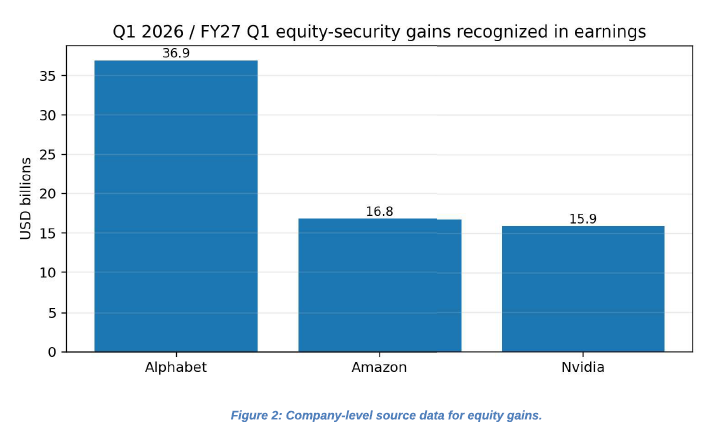
Will this continue? At least in the near-term, it seems likely, especially as these companies contemplate IPOs that reflect valuations above their current “fair value.” However, at some point, this may, and likely will, cut the other way.
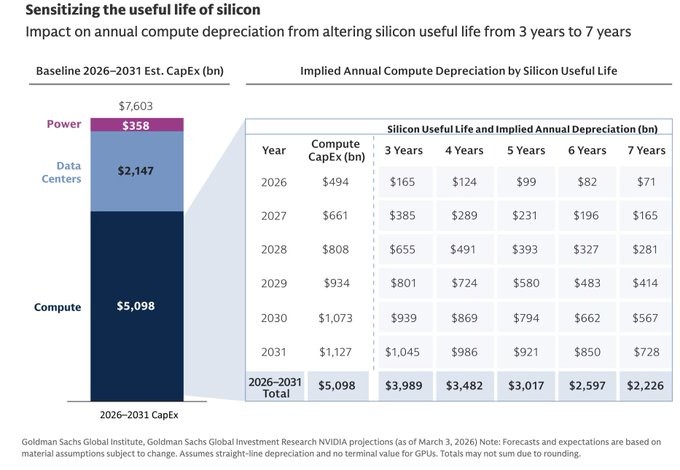
Additionally, we see a disconnect between revenues and expenses for companies in this ecosystem. For every $1 companies like Amazon, Google, and Meta uses to buy things like computer chips, its vendors, like Nvidia, recognize $1 in revenue. However, that $1 is not treated as an expense for the buyer; it is normally capitalized and depreciated over its useful life. If that life is five (5) years, its depreciation expense is $0.20 per year. So, at the index level, $1 of revenue flows to the seller of chips, but the buyer only incurs an expense of $0.20. We would contend this tends to overstate earnings, and it certainly allows earnings growth to continue to trend higher even as cash flow disappears for the buyers, as we see in the following.
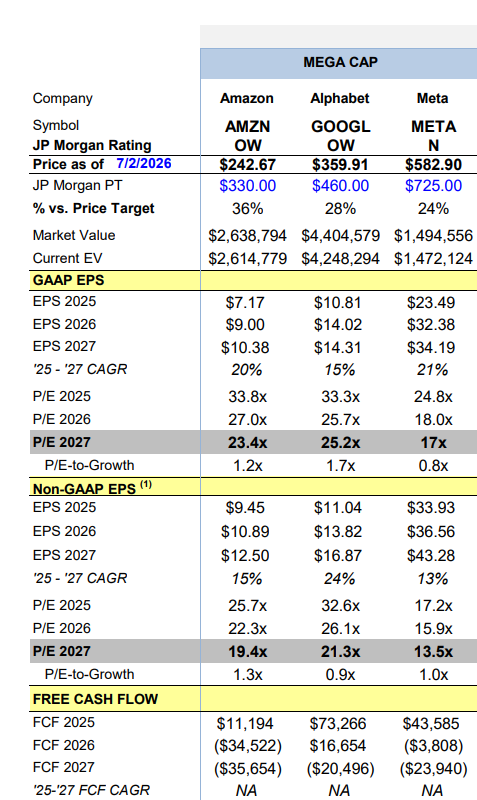
All three companies are expected to grow earnings into double-digits, even as cash flows go from a sizable surplus to large deficits for all three. However, with close to $7 trillion expected to be spent over the next six years, maybe the flood of capital makes accounting irrelevant:
In terms of the factors we track, little has changed. In general, the bias is slightly tilted toward the negative side but right now earnings growth is superseding everything else. For more details on all of our factors, click here.
| More Negative | Neutral | More Positive | |
|---|---|---|---|
| Inflation | ≈ | ||
| GDP Growth | ≈ | ||
| Fed Policy | ≈ | ||
| Interest Rates | ≈ | ||
| Credit Spreads | ≈ | ||
| Stock Multiples | ≈ | ||
| Earnings Growth | → | ||
| Deteriorating | ← | ||
| Stable | ≈ | ||
| Improving | → | ||
Conclusion: “Ach! They call this a soccer riot.”
The above phrase is uttered by soccer riot afficionado Groundskeeper Willie. We could say the same about those who call this a stock bubble, at least if we take P/E at face value. Stocks were more expensive in 2021, and far more expensive during the tech bubble.
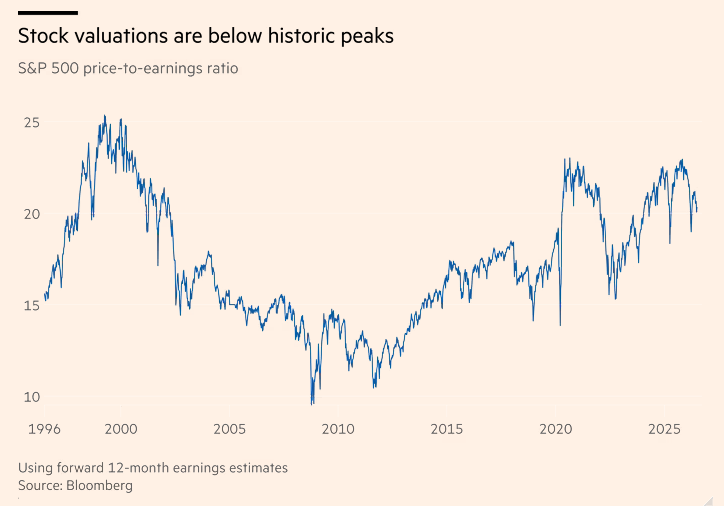
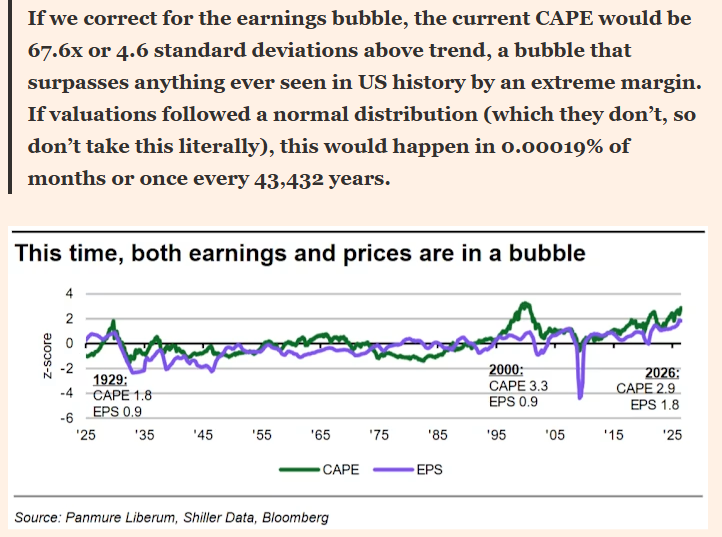
Taking the opposite side of this would be the Financial Times in an article titled This is nuts upon nuts. When’s the crash?
Much is dependent on the Fed’s new chair, Kevin Warsh. Historically, we have not seen accommodative policy and this type of dynamite earnings growth coincide. As the FT states, “If the Fed under new chair Kevin Warsh continues to stay ‘behind the curve,’ this provides scope for the bull market to continue in the short term.”
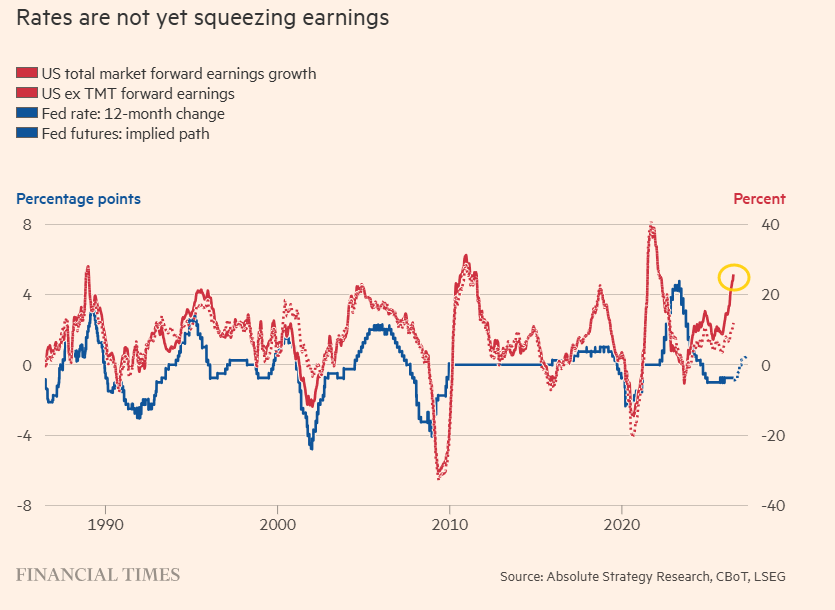
As Warren Pies, co-founder of 3Fourteen Research, stated on CNBC, “Bull markets do not die of old age. They’re usually murdered by the central bank.” Would a central banker who was given the job primarily because of a belief he would cut rates to accommodate a President more focused on the “STOCK MARKET” than any other in history have the fortitude to murder the bull to arrest inflation? It is worth reading this PBS piece summarizing Warsh’s comments delivered at a central bank conference to understand his framework. Also worth noting that though the chair historically has swayed policy that “When the Fed last met June 16-17, nearly half of the 19 policymakers signaled that they supported higher rates this year, while eight supported no change and one penciled in a cut. Warsh did not submit a forecast because of his opposition to providing guidance.”
As we started the year, the pathway to sizable market gains seemed challenging, given elevated multiples. Strong earnings growth has pushed the market toward all-time highs. However, at the index level, meaningful gains are predicated on earnings meeting (or exceeding) already lofty expectations, and multiples re-expanding back toward record levels.
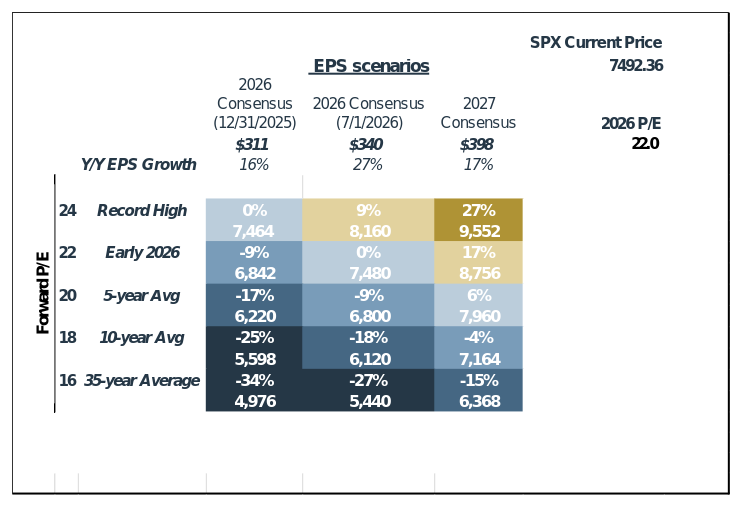
Source: FactSet; as of July 7, 2026
There is a famed soccer saying, “Form is fleeting; class is permanent.” Form is how you are doing right now; class is what you are over the long term. The form stocks right now are a small subset of companies that historically have not generated sustainably strong earnings growth or returns on capital; they have led the market higher. We are generally not interested in those. We are looking for class.
As J.P. Morgan writes in its 2Q 2026 Factor Views, “Historically, low quality stocks significantly outperform higher quality ones for short periods, followed by strong rebounds by quality. High quality stocks now trade at a discount to the broad market and relative to their long-term history—with no signs that fundamentals have deteriorated. The quality factor in U.S. markets is more attractive than at any time outside the dot-com bubble and the COVID-era dislocation.”
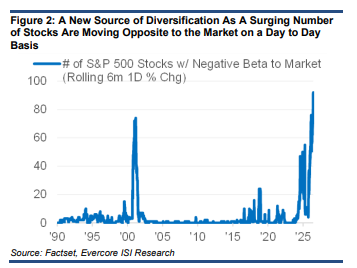
Recently, companies have been moving in the opposite direction of the market on any given day to a greater degree than at any other time. This represents a tremendous opportunity for our style of investing.
It’s often said they don’t ring a bell at the top. President Trump did just that when announcing the launch of the Trump account on the very same day the U.S. was eliminated from the World Cup. Coincidence? Probably.

However, in all seriousness, there are a lot of signs that the exuberance around AI stocks may be in extra time, to use the parlance of the beautiful game. You may know Samsung as the manufacturer of the television on which you are watching the World Cup, or as a mobile phone maker. However, the reason its stock has soared in its native Korea is because it sells computer memory, and lots of it, thanks to AI; it is the largest memory manufacturer in the world. Despite an 1,800% increase in profits and a doubling of revenue, the stock fell 7% on July 7th, though it is still up over 150% year-to-date. Why does this matter to us? Maybe this is a bell ringing for U.S. memory and chipmakers, too, as historically this industry has been very cyclical, whereas the current zeitgeist views memory demand as becoming a persistent secular grower thanks to AI.
It is easy to be lulled to sleep by the rapidity with which equities have recovered after the Iran excursion, like dozing off during the first 90 minutes of the Spain/Portugal match. The S&P is close to an all-time high, but as our research analyst Shelley Anthony notes, around 40% of the companies in the S&P 500 are over 20% below their 52-week highs; for the NASDAQ Composite, the figure is almost 68%. So, like in the World Cup, there are a lot of losers in the market and not many winners.
Also, like in the World Cup, circumstances matter. You don’t play aggressively when you have a lead over halfway through the match. Similarly, investors should not play aggressively when the markets have rallied sharply, and are highly valued, and have a “referee”, i.e., Kevin Warsh, who could change the rules any time. We aren’t going to “park the bus” but we will continue to try to manage drawdown risk while finding opportunities among the negative beta stocks today’s narrow market is ignoring.
In-depth analysis of Key Factors
1. Inflation – Negative but stable.
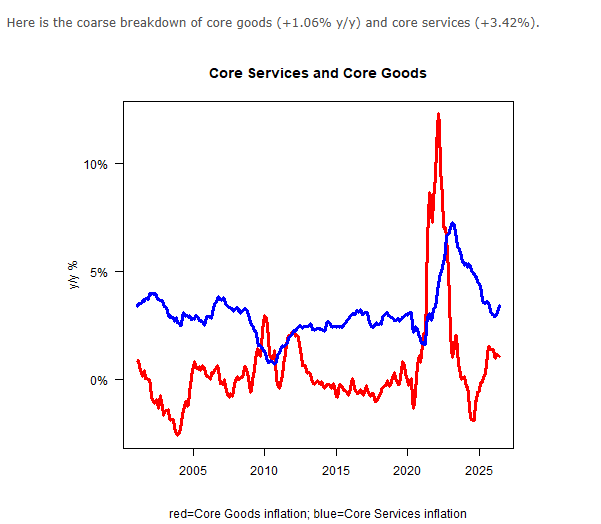
The decline in oil prices is expected to provide relief, making May’s 4.2% inflation, dare we say, transitory. As the Inflation Guy Mike Ashton notes, “I’m saying that while the headline inflation data look ugly, that will pass as energy prices decline. But I do think it will be difficult for the Fed to get comfortable with Median CPI going back up, or just not going back down, while growth is strong.” In other words, inflation is still above the Fed’s stated target and showing no meaningful signs of heading toward 2%.
Source: inflationguy.blog
2. GDP Growth – Neutral but stable.
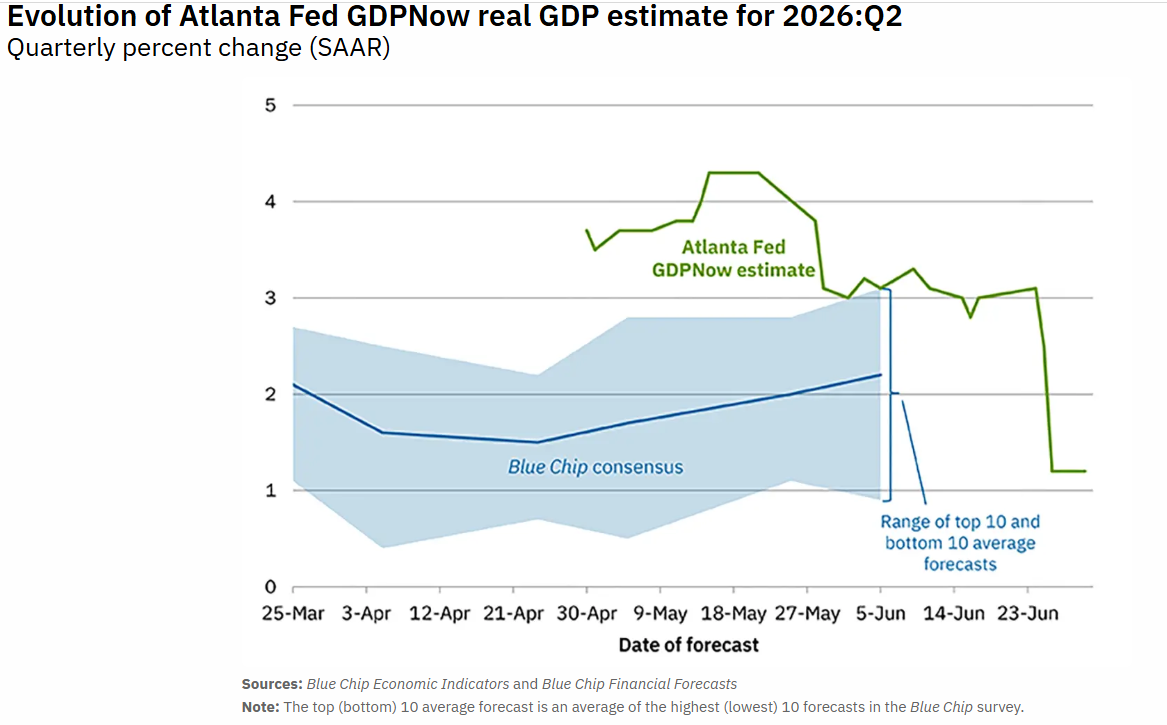
“Real gross domestic product (GDP) increased at an annual rate of 2.1 percent in the first quarter of 2026 (January, February, and March), according to the third estimate released today by the U.S. Bureau of Economic Analysis.” Atlanta Fed GDPNow forecasts have declined but are still positive. Overall, it seems like economic growth, fueled by the AI buildout, continues to grind higher, albeit at a relatively tepid pace.
3. Fed Policy – Neutral but stable.
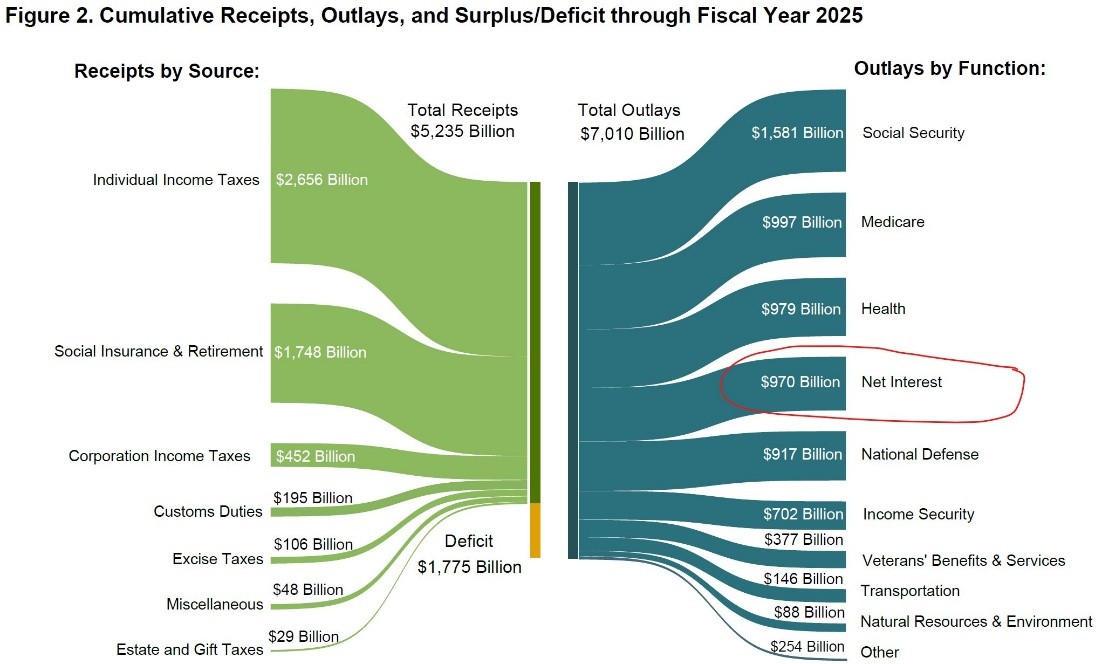
We should replace this with a question mark for now. New Fed chair Kevin Warsh has not been on the job long, but so far has expressed an interest in communicating less. Despite President Trump’s stated desire for lower rates, current expectations are for no moves in the near term, with hikes being seen as more likely than cuts over the next year. However, with interest expense at almost $1 trillion, the pressure may be on to cut rates irrespective of inflation.
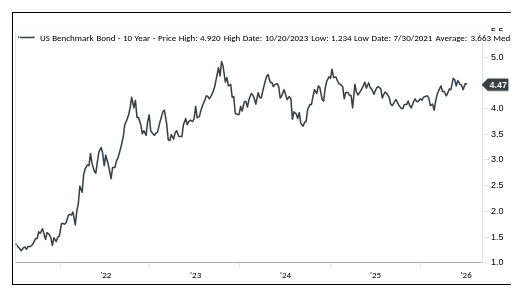
4. Interest rates – Negative but stable.
At around 4.5%, the 10-year yield is close to its year-to-date highs but has not broken out to a level we would consider extremely problematic.
Source: FactSet
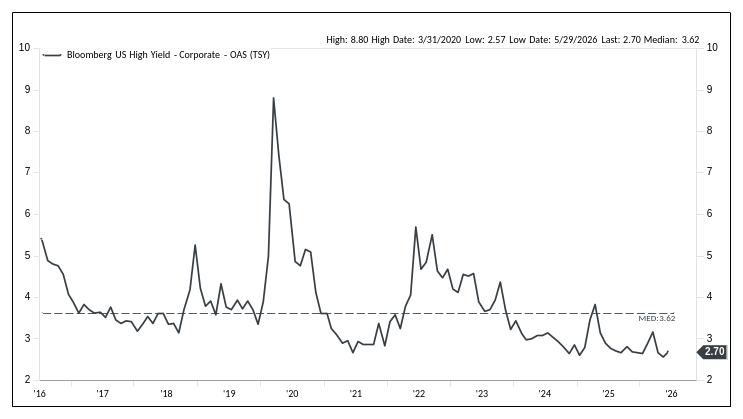
5. Credit spreads – Negative but stable.
A reminder we use this as a contrarian indicator. In other words, if we see spreads widening into the area above the green line, we may start to view risk/reward more favorably. Both high-yield spreads and investment grade spreads remained near record lows at the end of Q2. Despite myriad headlines regarding cracks in private credit, there remains little concern over public credit.
Source: FactSet
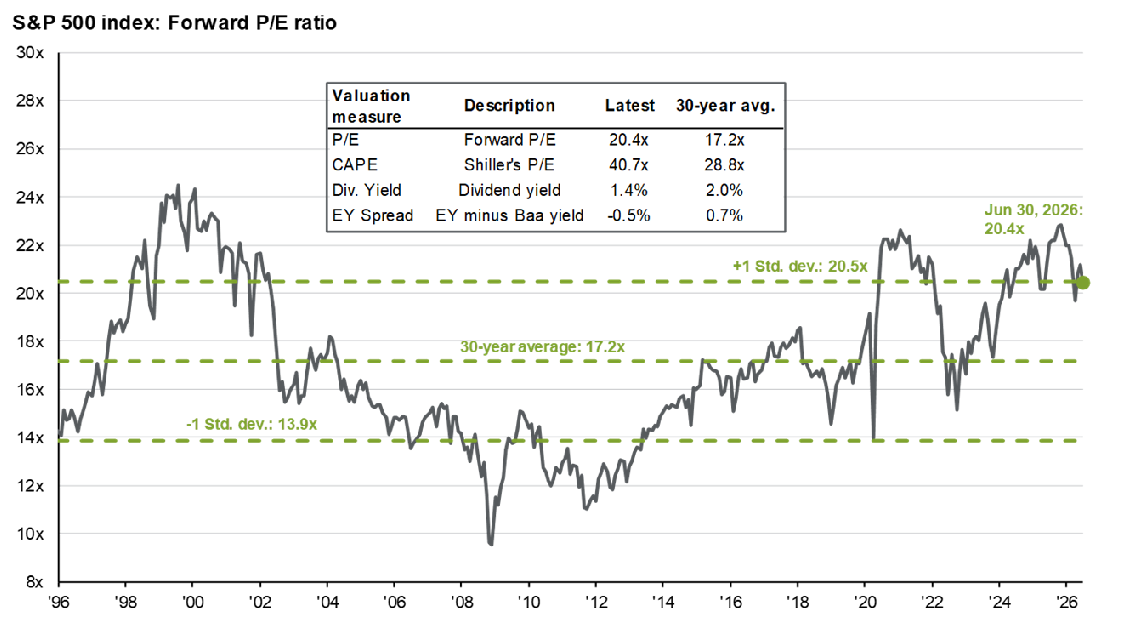
6. Stock multiples – Negative but stable.
After peaking at over 23x in Q4, multiples have compressed as earnings have grown significantly. At around 20x forward earnings, markets are around one standard deviation expensive versus historical norms. If we look at valuation by sector, every S&P 500 sector (except energy) trades above its 20-year average.
Source: J.P. Morgan Guide to the Markets
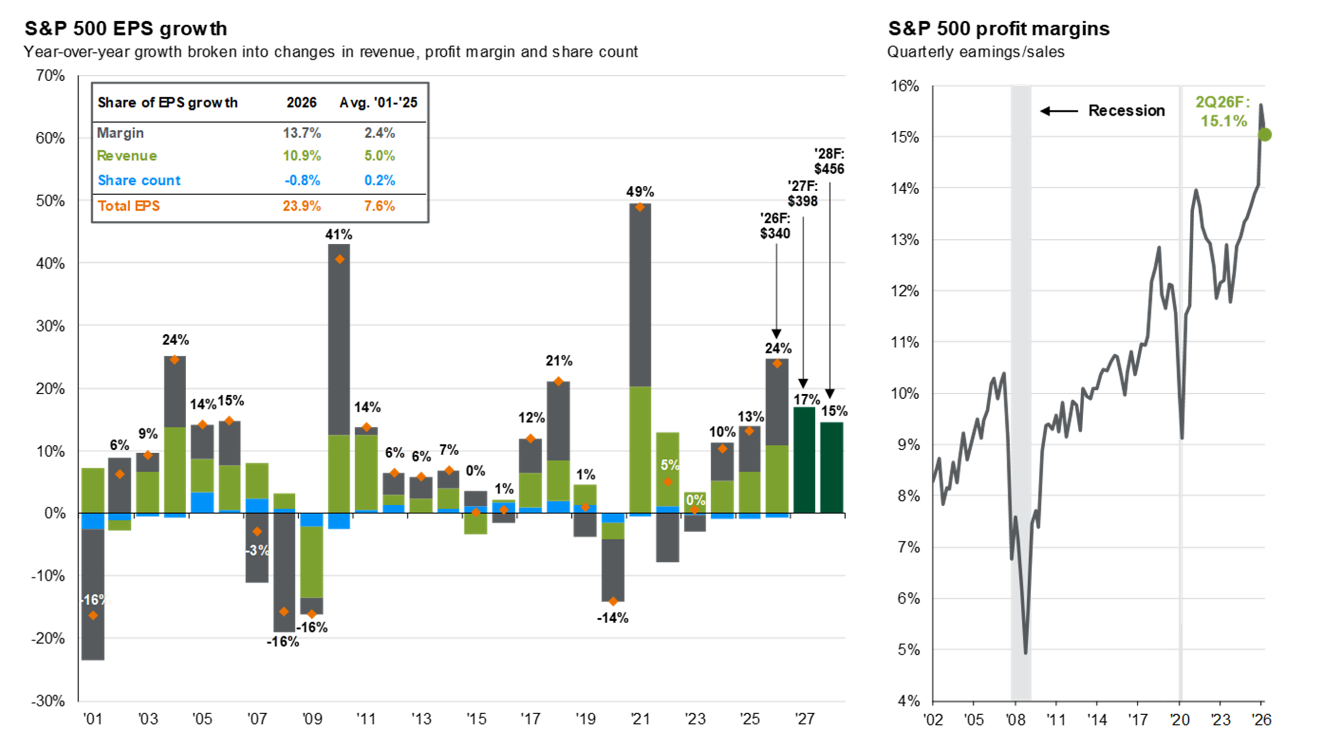
7. Earnings growth – Positive and improving.
Earnings growth is expected to continue to outpace its historical average by a wide margin. Estimates for 2026 continue to rise and growth is expected to accelerate significantly compared to the past several years. Margins have remained at peak levels and contributed more than ½ of EPS growth in 2026. Whether record margins can be sustained as GDP growth wanes and inflation runs above average is a key question.
Get Formidable News Direct to Your Inbox!
"*" indicates required fields
Check out our podcast Tea & Crumpets. Available on Apple Podcasts and Spotify.