

Adam Eagleston, CFA
Chief Investment Officer
Recently, my wife and daughter saw a musical adaptation of The Great Gatsby; I heard a lot of the songs in the car, unfortunately. This is the most recent adaptation of the classic novel, having been made into a movie on six occasions. It is unsurprising, given the book’s consistently high ranking among the greatest novels of all time; it trails only Ulysses on this list. I can’t objectively evaluate the quality of Ulysses, having started (but not finished) the novel on at least three occasions. Accordingly, let’s toast to excess and look to Gatsby’s 1920s for parallels with what is happening today.
Key Takeaways:
It takes two to make an accident.
- We had far more than two things trying to cause a market accident in Q3.
- Despite myriad challenges, both the S&P 500 and NASDAQ reached new all-time highs at varying points in Q3.
- However, those all-time high headlines masked considerable damage at the individual stock level, with over 50% of the stocks in the Russell 3000 down more than 20% since June.
It eluded us then, but that’s no matter—tomorrow we will run faster, stretch out our arms farther.
- Earnings growth has run faster than at almost any other time in history.
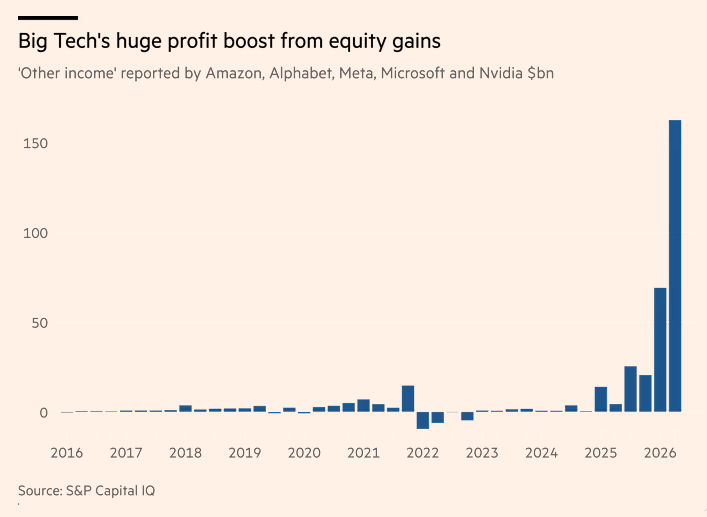
- “Other income” from the Magnificent Seven’s holdings of private AI companies has provided an artificial boost to earnings this year.
- Threatening to trip up the faster/farther narrative are interest rates, which are at multi-decade highs.
Can’t repeat the past?…Why of course you can!
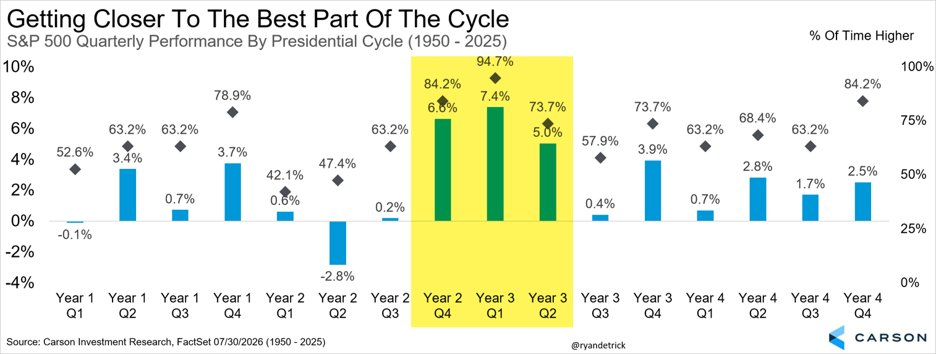
- If we repeat the past in terms of the presidential election cycle, equities should have a tailwind for the next few quarters.
- Although bond yields are higher, that does not necessarily mean the stock rally is over.
- Any adverse change in above-average (and narrow) earnings growth, above-average (and widening) government debt service, or above-average (and widening) index concentration could derail the party.
Before you close the email, please know these things:
- 1Over the past twelve months, only 9% of stocks outperformed the S&P 500.
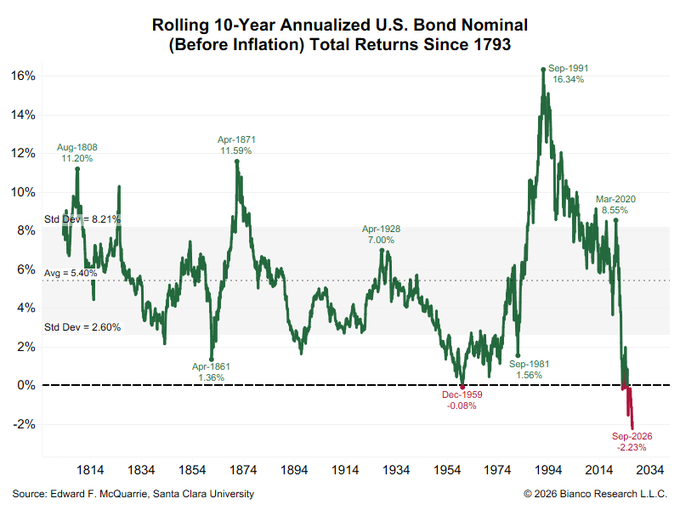
- 2Bonds have suffered their worst performance in over a century.
- 3The best performing stocks year-to-date were among the most speculative: high beta momentum, unprofitable technology, the most shorted, and those with the weakest balance sheets are each up over 30%.
- 4Despite speculation, stretched valuations, and optimistic earnings expectations, as the FT states, “If the Fed under new chair Kevin Warsh continues to stay ‘behind the curve,’ this provides scope for the bull market to continue in the short term.”
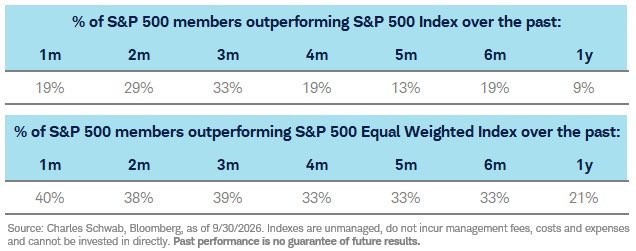
Q3 2026 Recap: “It takes two to make an accident.”

As with ill-fated love affairs, it typically takes a few things going wrong to make a market accident, too. Having said that, despite the best efforts of myriad factors, both the S&P 500 and NASDAQ reached new highs In August and September, respectively.
| Fund/Index | 1-Month | 3-Month | YTD | 1-Year |
|---|---|---|---|---|
| S&P 500 Index | -0.45 | 2.03 | 11.77 | 14.40 |
| Invesco S&P 500 Equal Weight E | -4.82 | -1.86 | 9.85 | 11.33 |
| Russell 2000 Index | -5.40 | -7.52 | 12.69 | 14.79 |
| NASDAQ Composite Index | 1.86 | 2.47 | 15.57 | 18.54 |
| iShares MSCI EAFE | -3.31 | 0.01 | 9.89 | 14.87 |
| iShares MSCI Emerging Markets | -0.34 | -2.37 | 22.72 | 27.16 |
| iShares Core US Agg Bond | -2.60 | -3.47 | -2.70 | -1.75 |
| iShares 20+ Year Treasury Bond | -5.36 | -8.88 | -7.79 | -8.62 |
| Invesco DB Commodity Index Tra | 3.26 | 21.23 | 44.54 | 46.76 |
Source: FactSet (as of most recent month end)
The reason for the resilience, according to Citadel, is that MSFT, NVDA, AAPL, and META alone added about 300 points to the S&P in Q3.
The other 490+ stocks together subtracted about 150 points. The equal-weight S&P 500, which is more representative of the average stock, declined 2% in Q3, and is currently on pace for a seventh straight week of declines. This has only happened two other times: during the 2002 postdotcom bust and the broad bear market of 2022. According to Morningstar, 44% of the stocks in the S&P 500 are down at least 20% from their 52-week high. 51% of the stocks in the Russell 3000 are down 20% since June. So we have had an accident, it’s just not apparent at the index level.
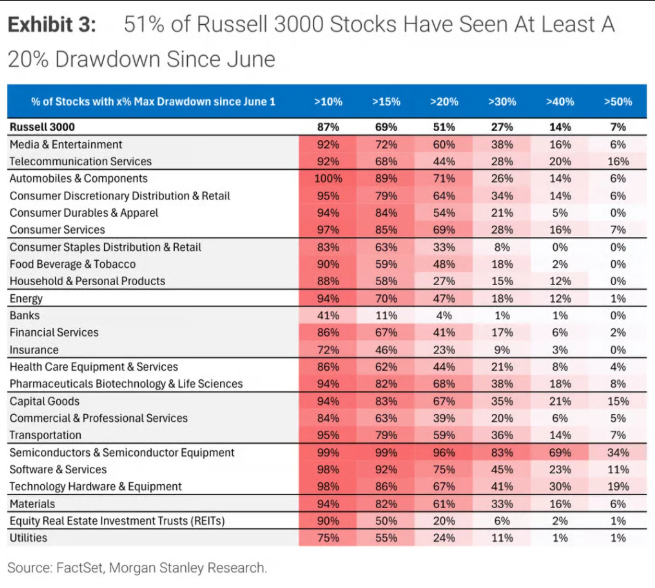
What we have seen is kind of like a multi-car pile-up, at least superficially: Geopolitical events (escalation of the wars in Ukraine and Iran) caused a spike in energy prices, which caused a spike in interest rates, which compressed stock multiples for most, but not all, stocks.
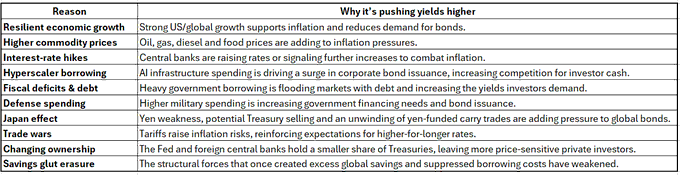
However, it may not be quite that simple. While we will return to this topic later, suffice it to say Bloomberg sees far more than just one reason that interest rates are higher; they count ten:
Bonds fared worse than stocks in Q3. The Aggregate Bond Index is in the midst of its longest decline on record (or at least since the 1970s). Data from BofA shows U.S. Treasuries are having their worst run in over 100 years, while a professor at Santa Clara is making the case this is the worst run for bonds since Hamilton was Treasury Secretary.
Q4 and 2026 Outlook: “It eluded us then, but that’s no matter—tomorrow we will run faster, stretch out our arms farther.”
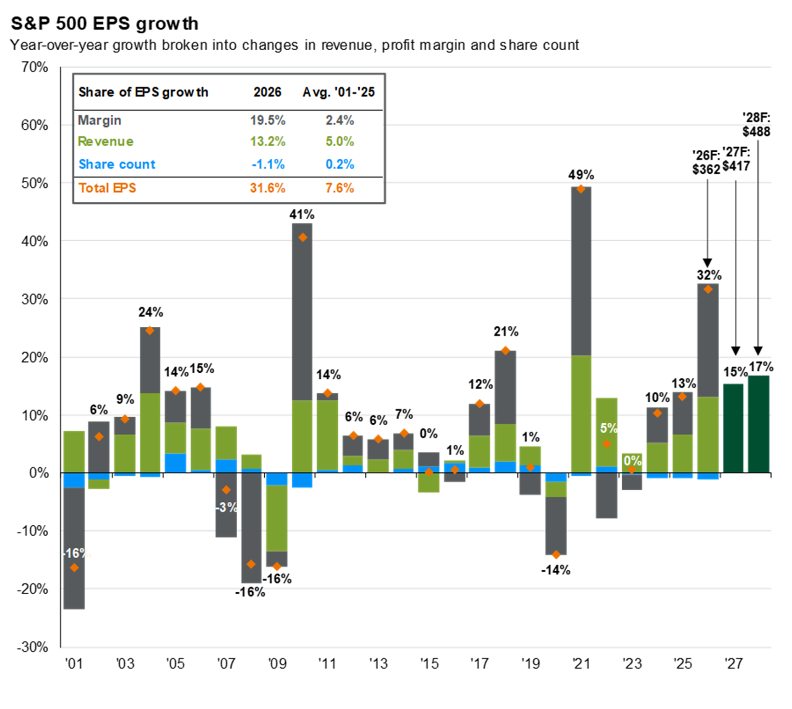
So, what allowed the S&P 500 and the NASDAQ to stretch out farther in Q3? Earnings. 2026 has been a banner earnings year. With a forecasted earnings growth rate of 32%, we are at almost thrice the historical average, a level typically only seen after a rebound from a recession. A key piece of the earnings equation is margin; S&P 500 operating margins neared a record 18% last quarter.
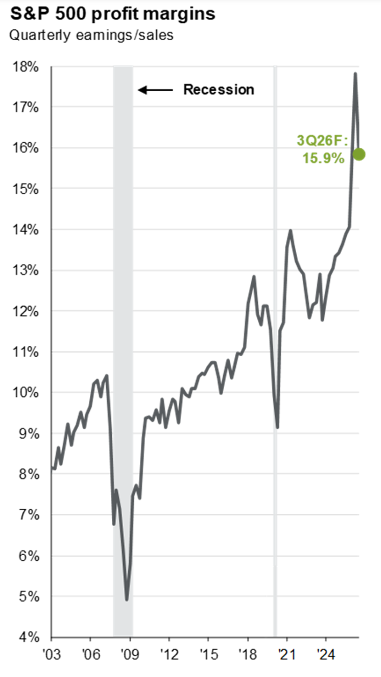
Source: J.P. Morgan
This type of earnings growth is unsustainable. We believe one reason is summarized here by the Financial Times, “In the most recent round of earnings reports, pre-tax profits reached a record at several of the Big Tech ‘hyperscalers’. But the main source of these increases at Alphabet and Amazon was ‘other income’ from gains on SpaceX and Anthropic, rather than new business lines or fresh cash generation.” While earnings projections for the next few years are lower, analysts continue to forecast mid-teens growth for the next two years, which is still above average.
This earnings growth is being discounted at a higher rate, given the upward move in interest rates, dampening returns:
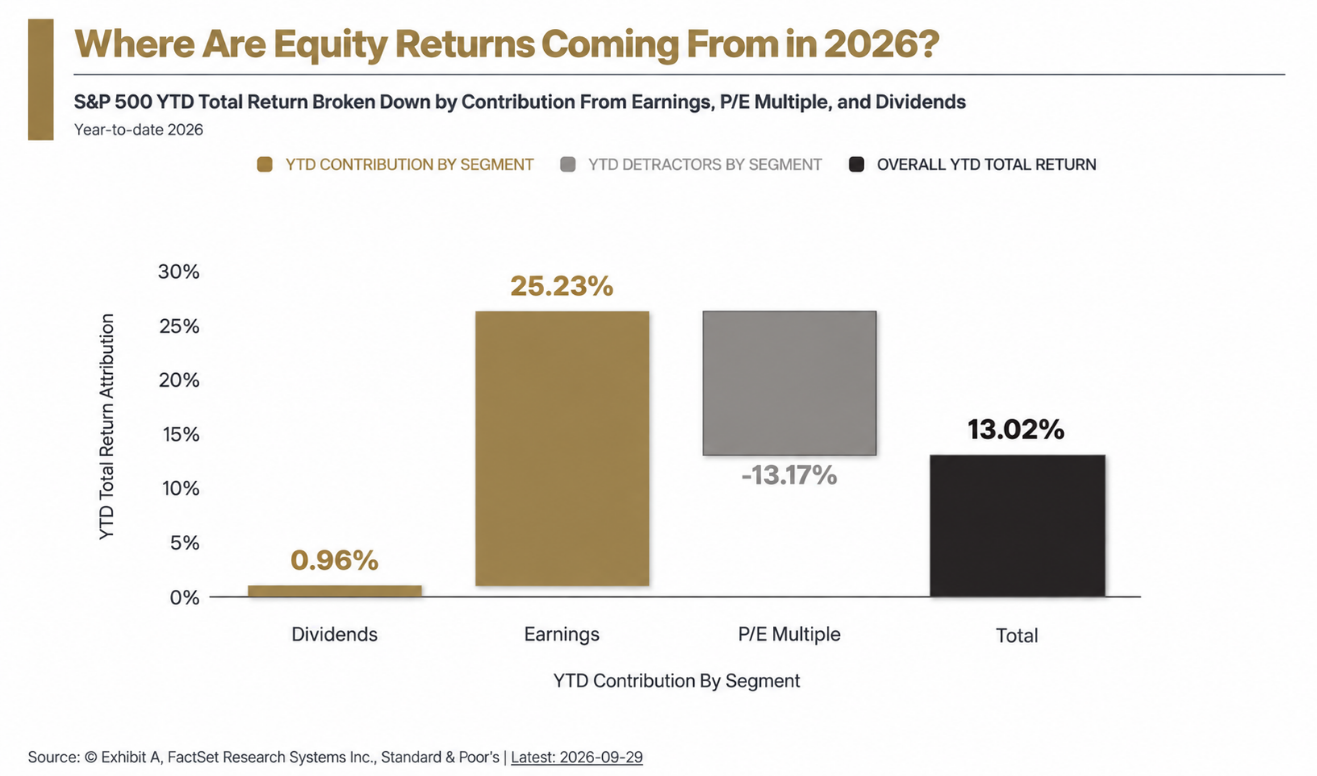
In terms of the factors we track, interest rates made the biggest move on the negative side, in part due to Fed policy. In general, the bias remains tilted toward the negative side but right now earnings growth is superseding everything else. For more details on all of our factors, click here.
| More Negative | Neutral | More Positive | |
|---|---|---|---|
| Inflation | ≈ | ||
| GDP Growth | ≈ | ||
| Fed Policy | ← | ||
| Interest Rates | ← | ||
| Credit Spreads | ≈ | ||
| Stock Multiples | ≈ | ||
| Earnings Growth | → | ||
| Deteriorating | ← | ||
| Stable | ≈ | ||
| Improving | → | ||
Conclusion: “Can’t repeat the past?…Why of course you can!”
This misconception is what ultimately leads to (spoiler alert) Gatsby’s death. From a market perspective, we often repeat the past, for better or worse. Our hope is that this presidential election cycle chart is repeated:
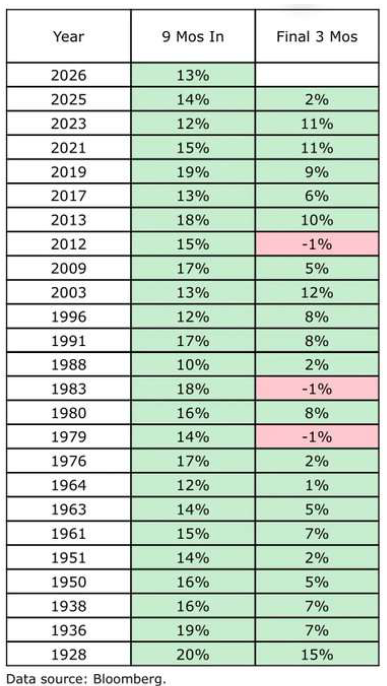
Similarly, when the S&P 500 gains more than 10% during the first three quarters, the odds are tied toward further gains (with no major drawdowns):
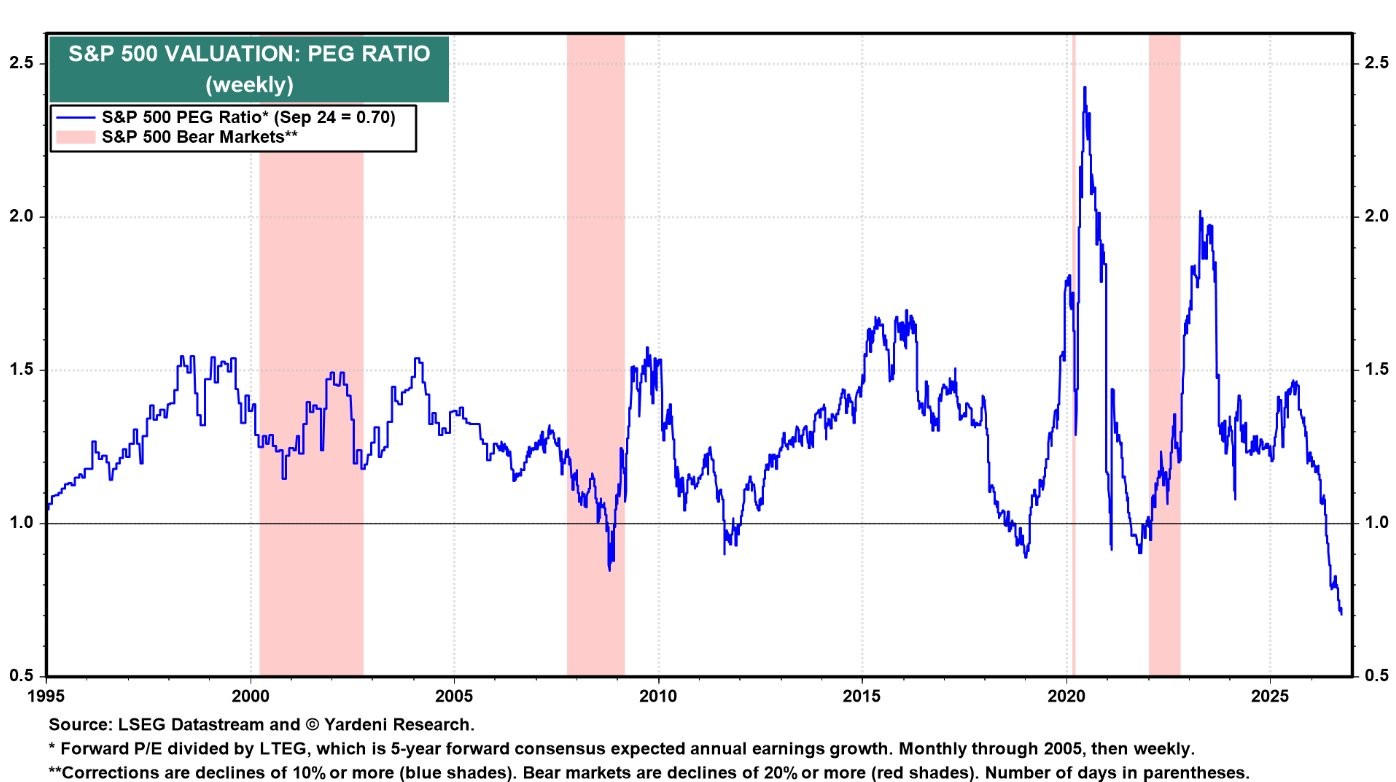
For those looking for the bull case, once again, it is earnings. The market has never traded at a lower price to earnings growth ratio:
Additionally, our internal model shows market upside if 2027 earnings are achieved (and multiples remain around where they are currently):
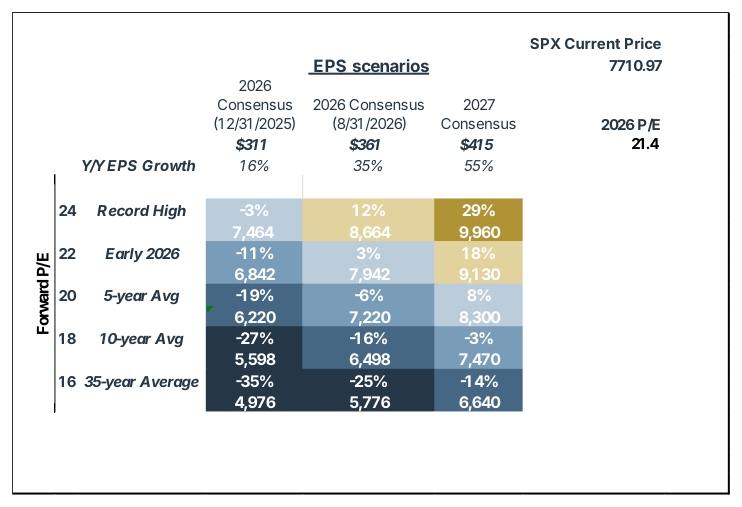
Source: FactSet; as of October 1, 2026
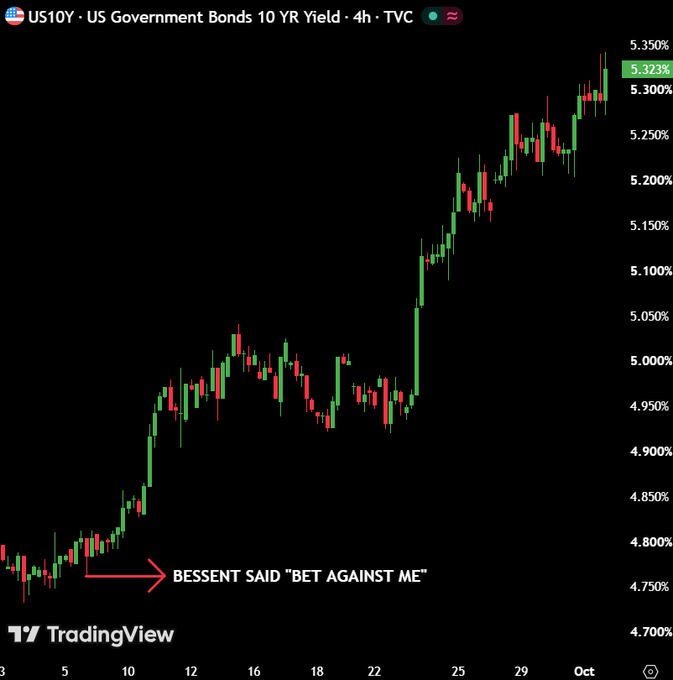
However, sometimes that past is elusive, and tragedy ensues. In looking at what series of unfortunate events could cause a Gatsby-like outcome for the current bull market, the most likely George Wilson is the bond market. The man currently in the role of Tom Buchanan, i.e., the person trying to pull one over on poor George, is Scott Bessent. He boldly claimed in early September he was “the house” and dared investors to bet against him. Well, they did, and yields did this:
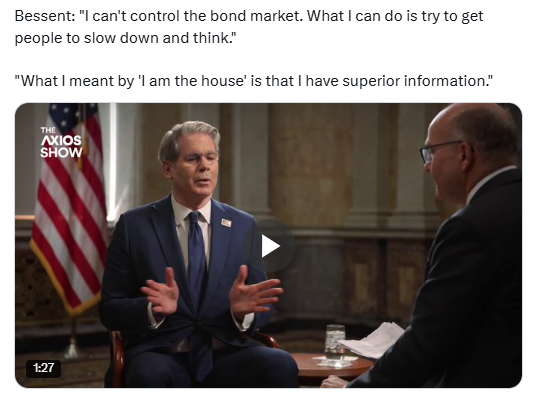
Accordingly, he walked this back over the weekend, seemingly learning this lesson from famed campaign strategist James Carville, who stated, “I used to think that if there was reincarnation, I wanted to come back as the President or the Pope or as a .400 baseball hitter. But now I would like to come back as the bond market. You can intimidate everybody.”
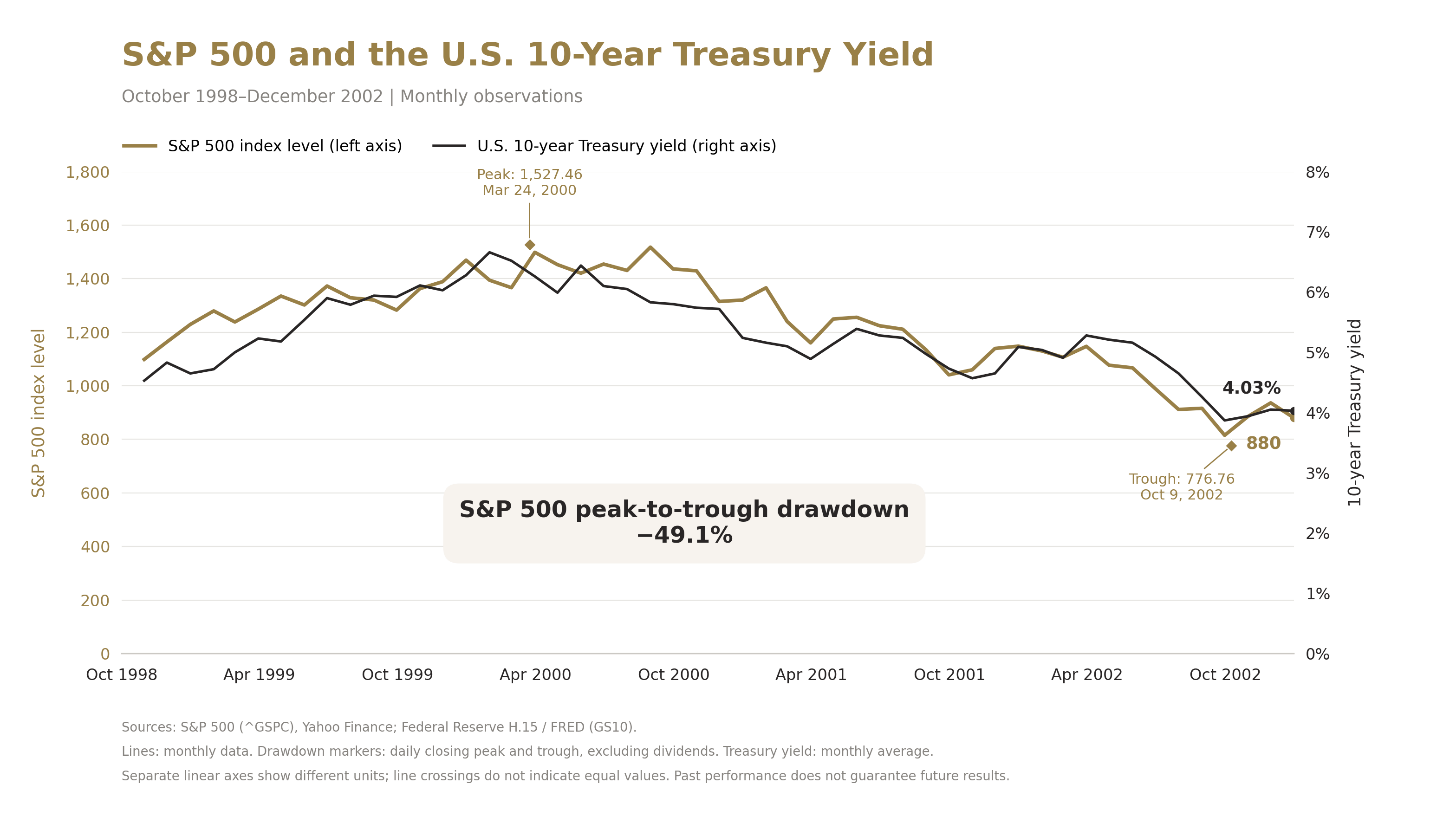
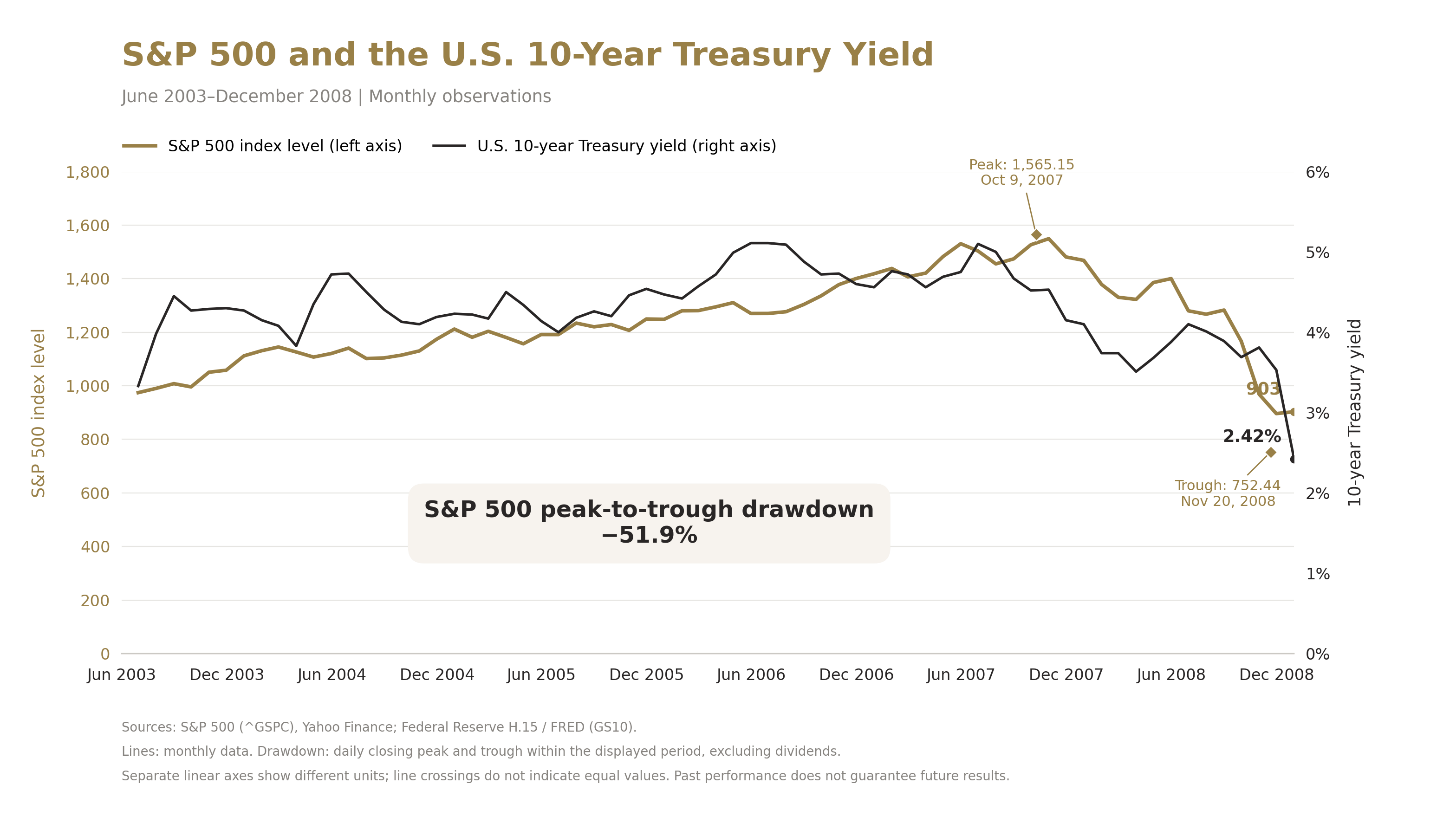
It is important to note that just because bond yields are higher does not necessarily mean stocks have to go lower. An analysis of prior instances when bond yields increased over 1% shows the S&P 500 has generally performed well during the time when yields were increasing, as well as over the following 12 months. Why is that? Well, higher yields are often associated with higher growth, which tends to help corporate earnings, so the story checks out.
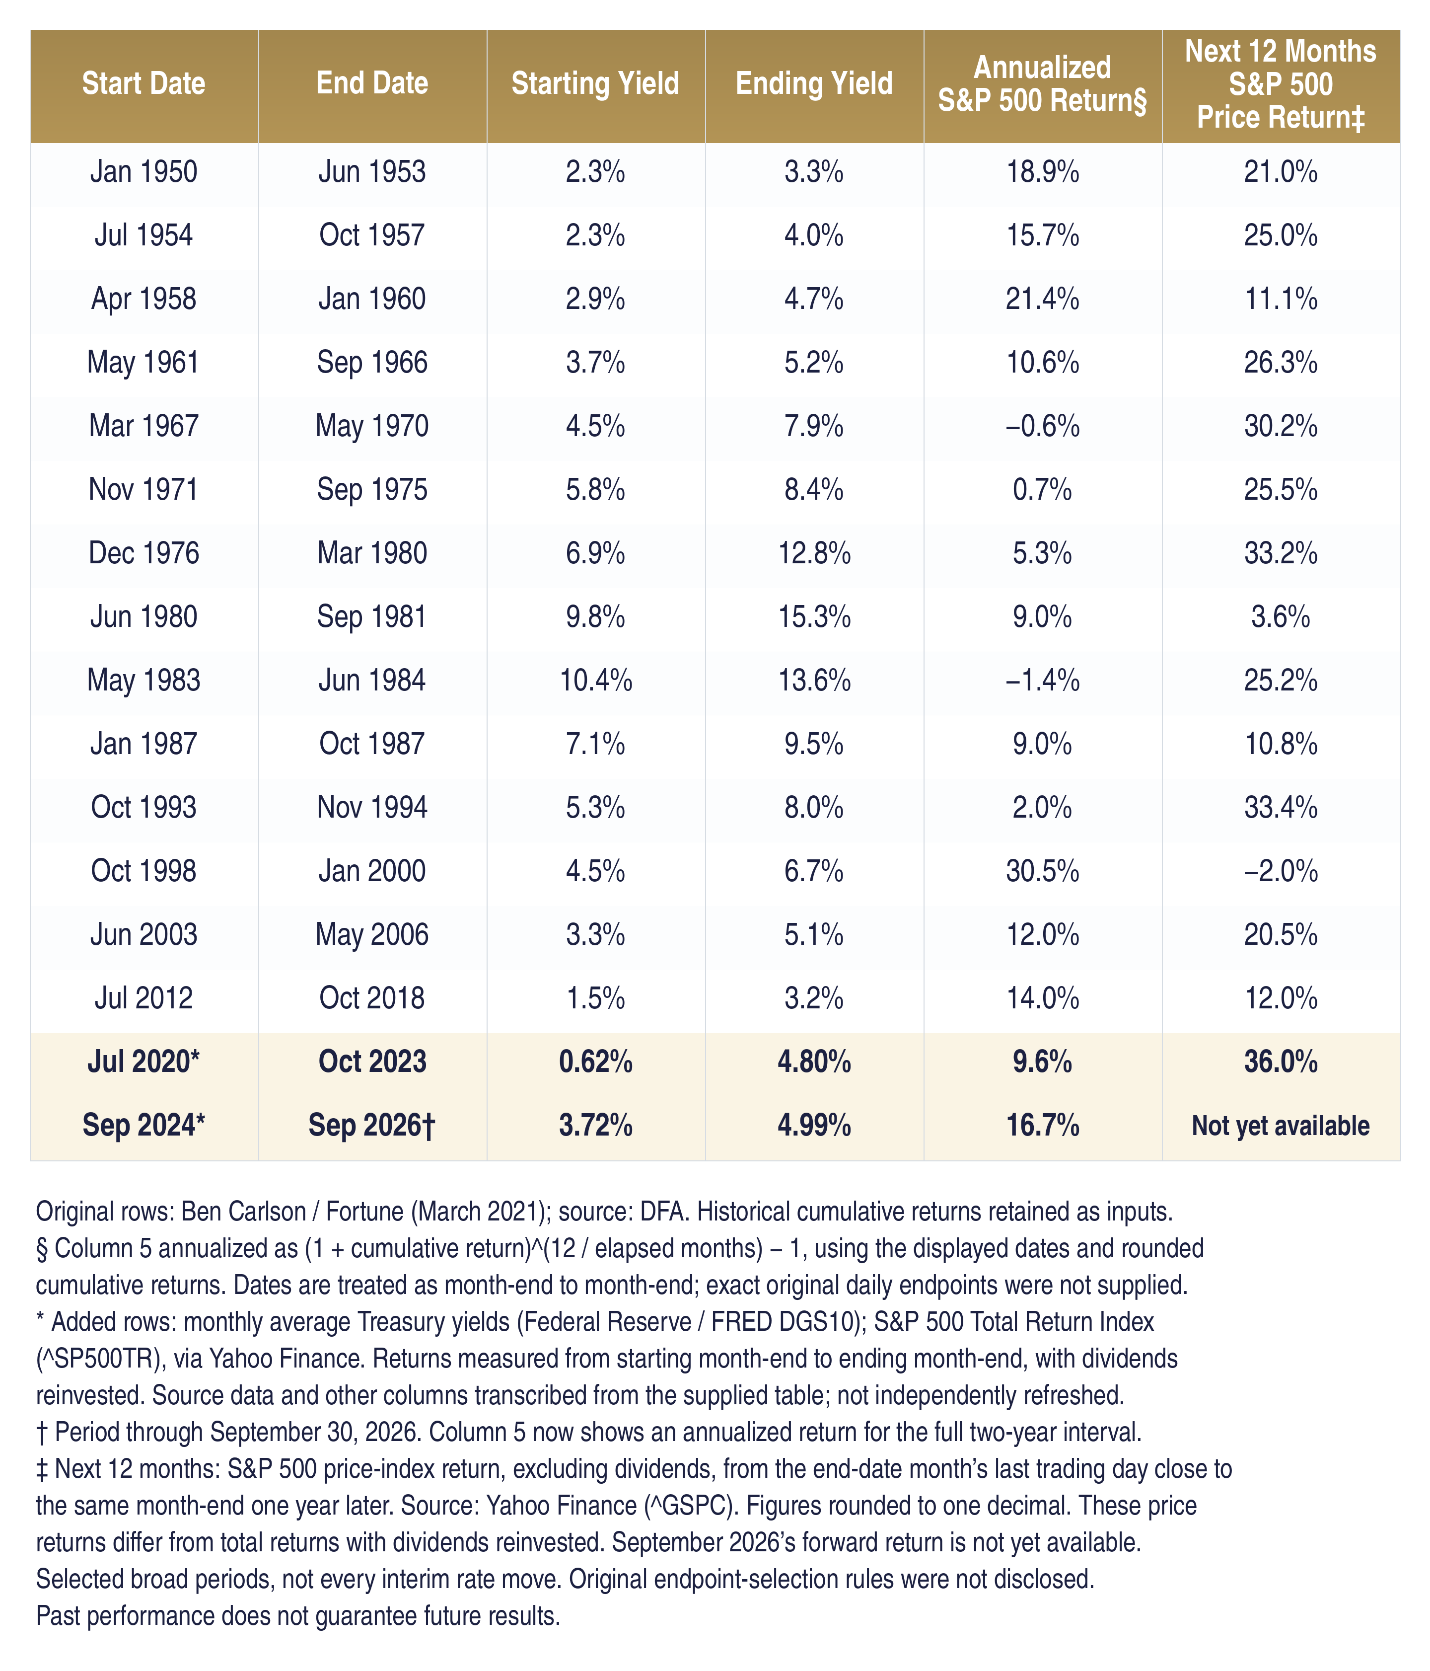
The caveat here is that in a few cases it appears the cumulative effect of higher rates led to a severe drawdown…eventually. Specifically, January 2000 and May 2006 jump out as periods that ultimately turned out to be problematic. Paradoxically, at least in these cases, the time to get concerned about stocks was when rates started to fall.
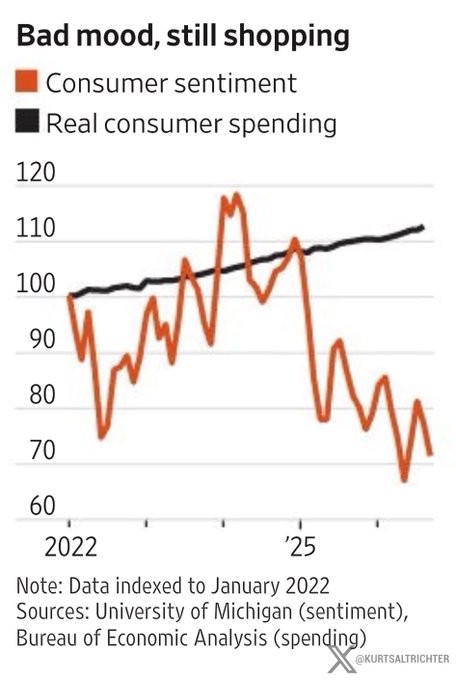
One of the things that resonates with readers is how Fitzgerald captured t vibes of the roaring 20s in many of his books. Right now, we have a strange juxtaposition in the world of vibes. On the one hand, consumer sentiment is awful as households face higher prices for most things and overall mental health seems tenuous at best post-Covid. And yet, consumer spending continues unabated. Why? At the upper end of the income spectrum, where the Buchanans are, record corporate profits have boosted portfolio values and higher interest rates mean more interest income. As the lyrics to New Money state, “When your money makes you money, What’s the well-to-do to do? But buy another pony, With the interest they accrue?”
According to Charlie Bilello, “The top 0.1% of US households now own 15% of all household wealth, a record high. Meanwhile, the bottom 50% own just 2%. The wealth gap has never been wider.”
That wealth gap reminds us of the Valley of Ashes, where the workers, to use a loaded term, have seen their share of profits dip to the lowest levels on record. Adding insult to injury, wages are not keeping pace with inflation.
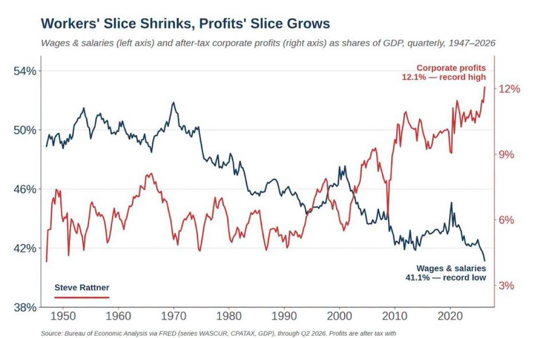
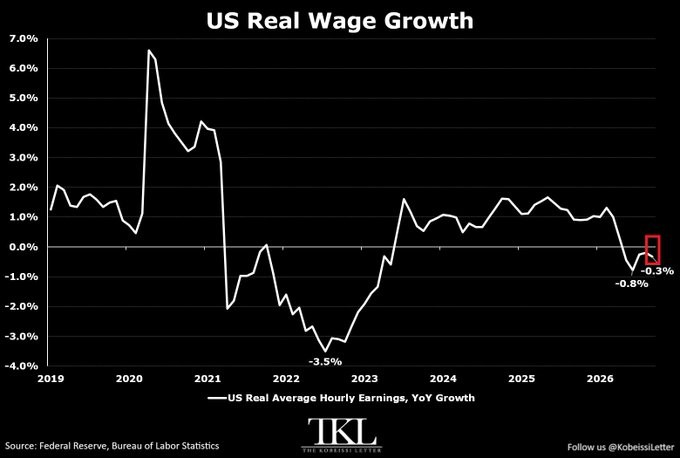
Just as in Gatsby’s time, our 20s are also roaring. What could cause the end of the roaring 2020s? Ironically enough, maybe a bond salesman in this case, too? (The narrator of The Great Gatsby, Nick Carraway, is a bond salesman, and at least partially to blame for the lead character’s untimely demise). Yes, we did just review past instances where stocks not only shook off, but thrived, despite higher rates. However, at no time was government debt so problematic; here are the stats:
- Over $40 trillion in outstanding debt.
- Over 125% of GDP.
- Requires interest payments of over $1 trillion per year.
As the article states, “We’re rolling over an adjustable-rate loan the size of the economy.”
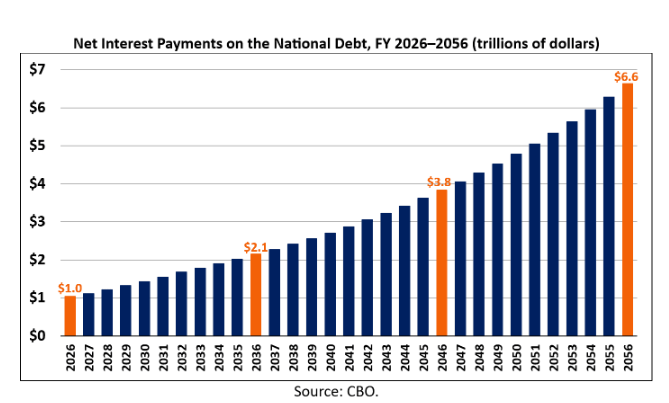
At present, neither political party has the will to take on the deficit, much less the debt. We are left with the typical solution of “we will grow our way out of it”, though President Trump was recently more candid, as seen here. To the degree Fed Chair Warsh is aligned with this approach, there would be consequences for interest rates and the dollar.
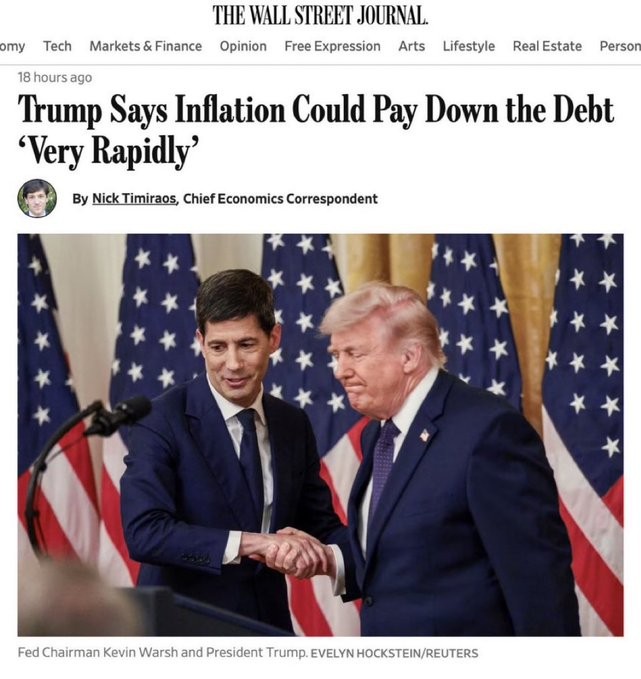
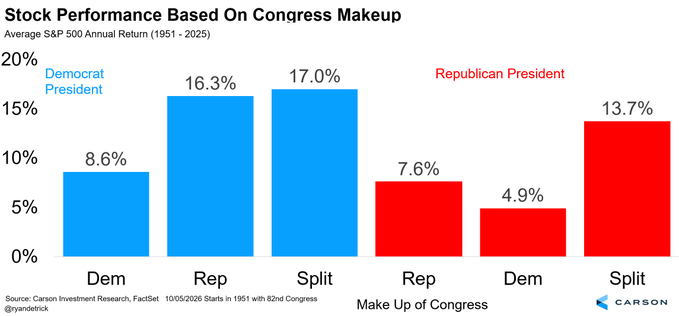
Which brings us to politics, and another thing that could derail the bull market. Oddsmakers currently ascribe around a 70% chance of Democrats taking the House and Senate. Much could change between now and November, though if those predictions hold true, we would be in the worse regime possible for stocks, with an average annual return of 4.9%. We will set aside any conjecture over contested election results, though that type of tumult could clearly upset markets, and while not a black swan, would be unwelcome.
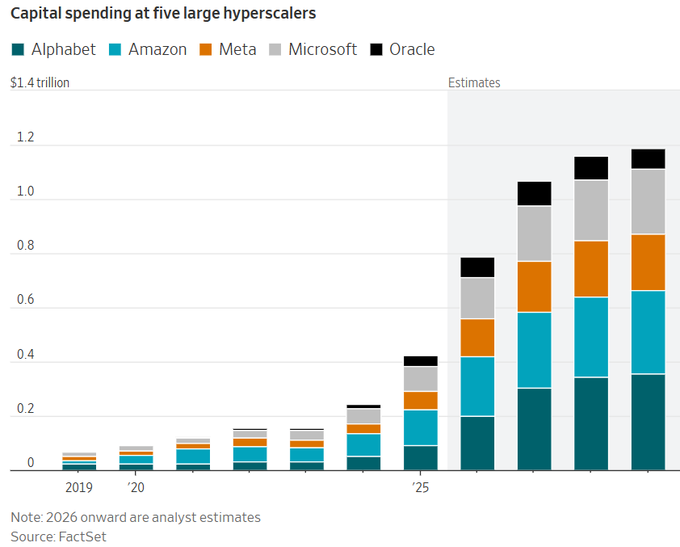
In our mind, the most likely thing to derail a continuation of the outsized gains we have seen for stocks is, well, math; specifically, the concept of natural limits. Hyperscalers are expected to spend over $1 trillion next year on capex, the vast majority on AI (chips, data centers, etc.).
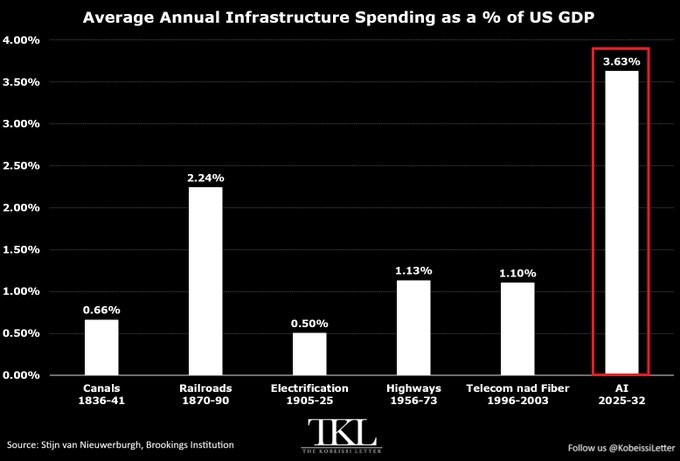
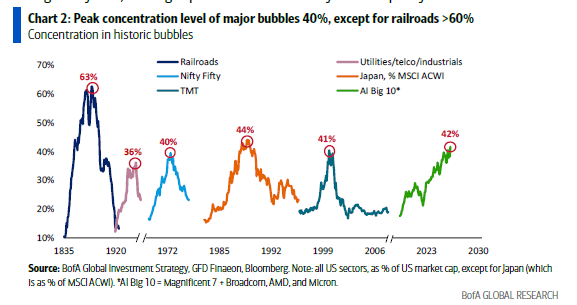
The returns on these investments are still yet to be determined, and as a percentage of GDP, the level of spend projected for the AI buildout exceeds all other major infrastructure booms in the U.S by a wide margin. Typically, these capex cycles has seen a concentration of equities of those sectors reach a level of around 40% before abating; we are at 42% now, according to BofA, though by some measures, i.e., looking at S&P sector weights for technology and communication services, one could argue it is closer to 50%; railroads topped out at over 60%, and that was the largest boom previously.
Once nominal dollars reach this level, as in the case of AI spend, or the percentages, be it of AI stocks in the index or earnings growth, reach the levels where they are now, maintaining that level of growth becomes mathematically more difficult. Unlike Marge Simpson, my children often ask when they are ever going to need to know calculus in their daily lives; well, here you go. Let’s use earnings as an example.
| Year | Projected EPS | Earnings growth | Change in growth versus prior year |
|---|---|---|---|
| 2026 | $363.71 | 34.07% | +22.30 percentage points |
| 2027 | $419.54 | 15.35% | −18.72 percentage points |
| 2028 | $486.92 | 16.06% | +0.71 percentage points |
Trailing S&P 500 profits are around $2.7 trillion; GDP is around $32.5 trillion, so profits are around 8% of GDP. If profits were to keep growing at 34% for the next two years, they would reach $4.8 trillion, and account for 13-15%, assuming normal (somewhere between 0% and 5%) GDP growth. This is just mathematically unlikely. Even the current mid-teens estimates reflect above average growth, yet also reflect a slowdown in the second derivative, i.e., the rate of change of the rate of change, of almost 19%. The market often does not celebrate slowing growth.
Moreover, more than 1/3 of the projected growth comes from two (2) companies; these two, (Nvidia and Micron) will generate more earnings growth than the bottom 490 companies.
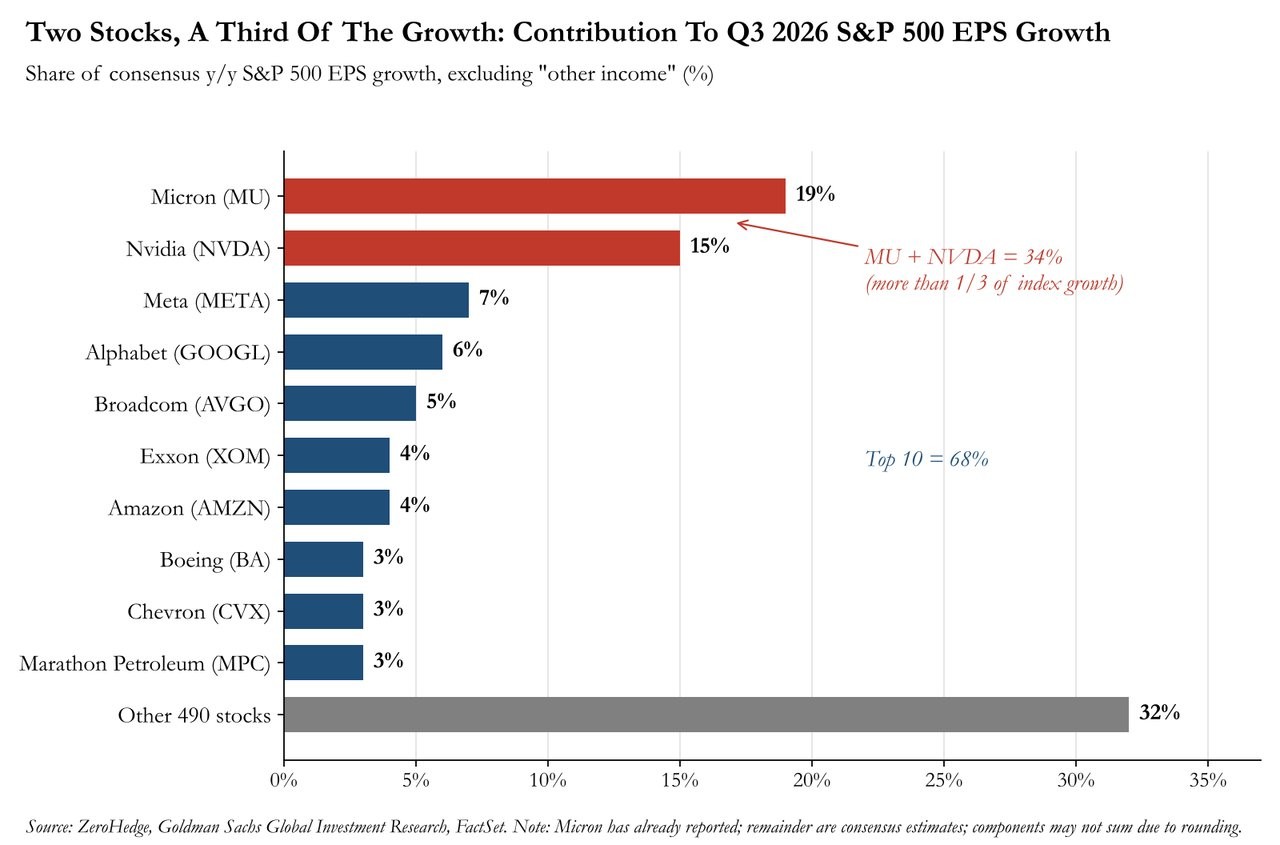
Our concern with this math is that the AI bulls are like Gatsby, as described here, “His dream must have seemed so close that he could hardly fail to grasp it. He did not know that it was already behind him.” It seems like the earnings growth portion of the AI dream may be behind us, given the simple math and the increasing competitive pressure these companies will face.
That is not to say we are bearish on AI, or SI, as is now apparently the preferred nomenclature. It is just that we believe that security selection and risk management are important against this backdrop, and, as Callum Thomas states in a post about his article “Unsafe Investing,” “The average passive Index Investor is heavily exposed to Tech, has record low weight to Defensives. This is part of a larger pattern where the average investor is basically running a portfolio that is consciously or not Max-Risk, and Min-Defense. This has actually been the right mix over the past few years, but this is a portfolio that is built for yesterday.
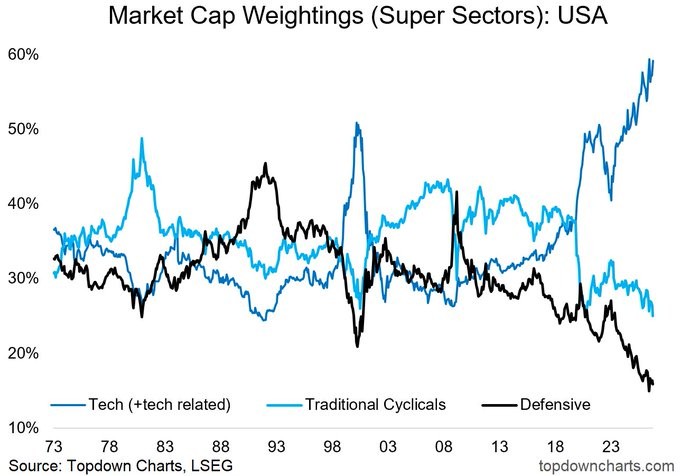
The Great Gatsby closes with one of the more iconic lines in American literature, “So we beat on, boats against the current, borne back ceaselessly into the past.” The AI wave is the future, and our intent is not to be a boat fighting against that current but hopefully helping our investors navigate both the potential rewards and risks associated with this version of the roaring 20s.
In-depth analysis of Key Factors
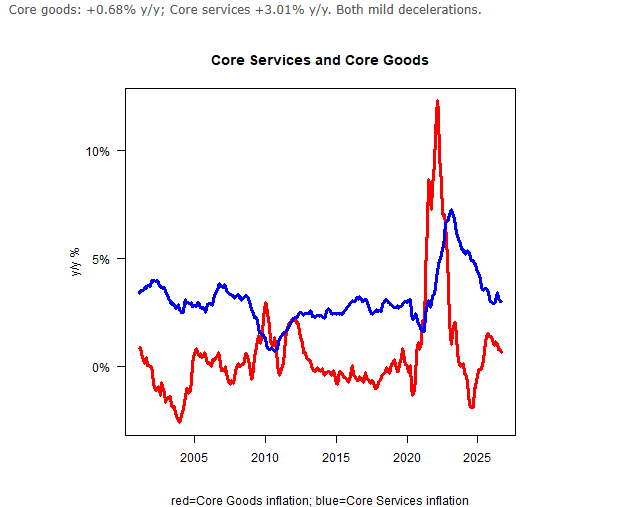
1. Inflation – Negative but stable.
Higher energy prices were not helpful. In general, inflation has remained persistently above the Fed’s target, and will likely increase over the next few months because of last year’s government shutdown and the “estimated” inflation figures associated with it. Inflation guy Mike Ashton’s key takeaway from the most recent inflation print was, “This CPI figure shouldn’t move the needle towards a hike, but it probably will.”
Source: inflationguy.blog
2. GDP Growth – Neutral but stable.
“Real gross domestic product (GDP) increased at an annual rate of 2.2 percent in the second quarter of 2026 (April, May, and June), according to the third estimate released today by the U.S. Bureau of Economic Analysis (BEA). In the first quarter, real GDP increased 2.5 percent (revised).”
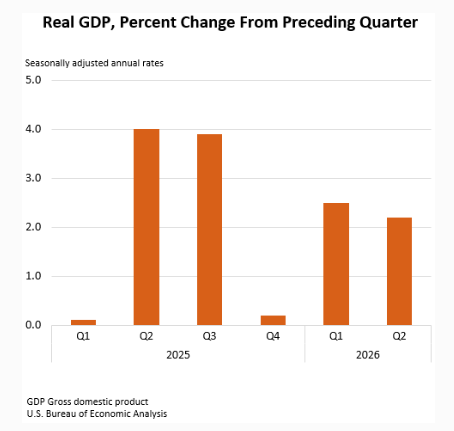
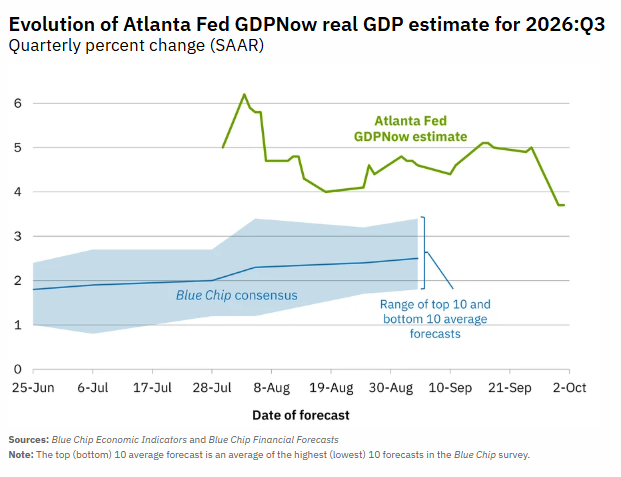
Atlanta Fed GDPNow forecasts have declined but are still positive. Overall, it seems like economic growth, fueled by the AI buildout, continues to grind higher, albeit at a relatively tepid pace.
3. Fed Policy – Negative and deteriorating.
We saw a unanimous rate hike at the Fed’s September meeting, the first hike in over three years. Under new Fed chair Kevin Warsh, the statement was laconic; the key line was “Inflation remains elevated. Today’s policy action will support a timelier return to the Committee’s 2 goal. The Committee will deliver price stability.” This is seemingly at odds with the President’s expectations from his new Fed chair, as mentioned previously. However, odds of an October hike are only 14%, and the Fed’s balance sheet has slightly increased, so policy is not overly restrictive.
4. Interest rates – Negative and deteriorating.
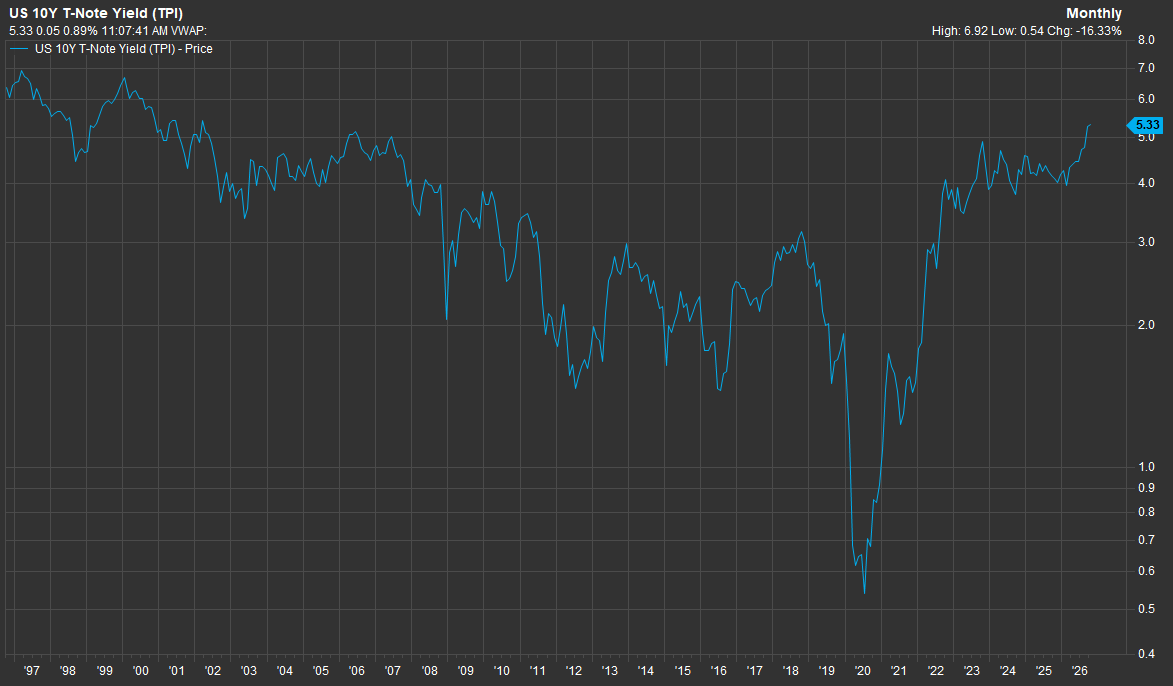
This is where things get dicey. The yield on the benchmark U.S. 10-year Treasury is now over 5.25%, a level last seen in 2002. This is having a chilling effect on the housing market with mortgage rates now over 7%.
Source: FactSet
5. Credit spreads – Negative but stable.
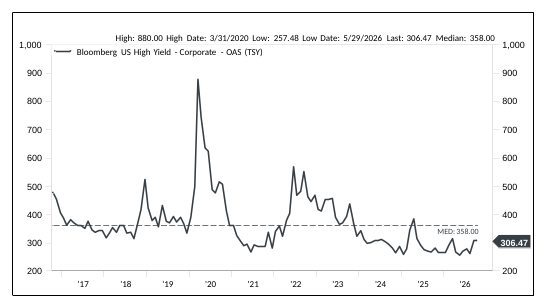
A reminder we use this as a contrarian indicator. In other words, if we see spreads widening into the area above the line, we may start to view risk/reward more favorably. Both high-yield spreads and investment grade spreads remained near record lows at the end of Q3, though high yield did show a modicum of widening late in the quarter, and certain bonds issued by hyperscalers have been under pressure.
Source: FactSet
6. Stock multiples – Negative but stable.
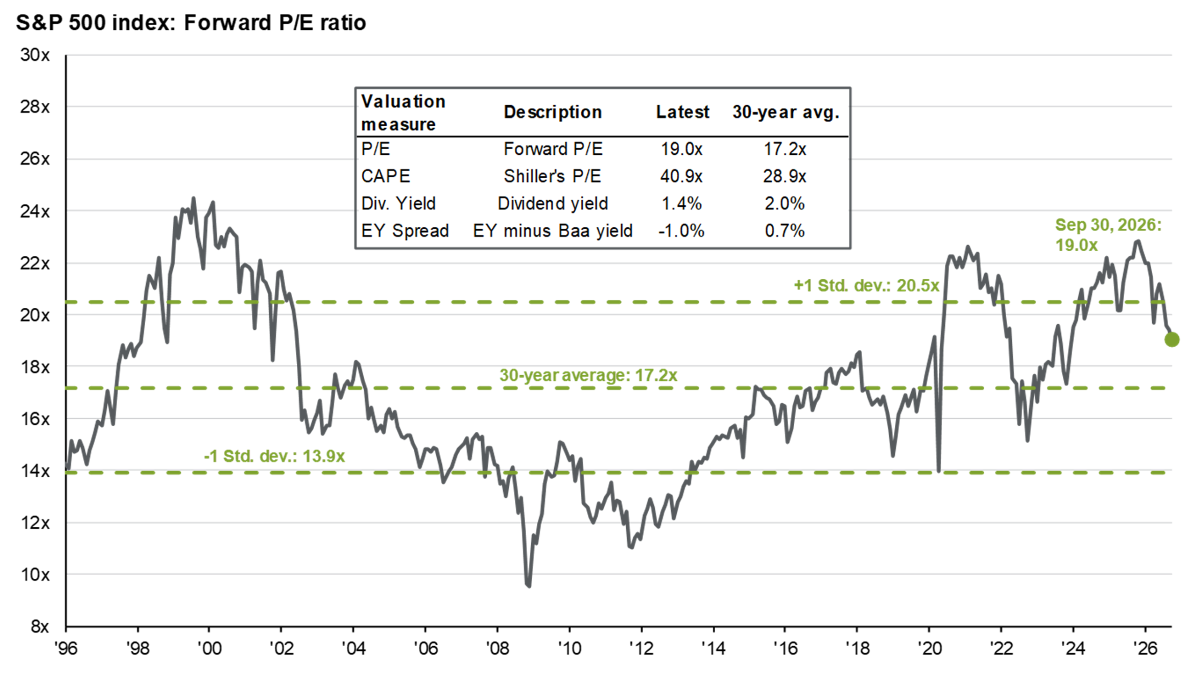
After peaking at over 23x in Q4, multiples continue to compress as earnings have grown significantly. At around 19x forward earnings, markets are only a little expensive versus historical norms. If we look at valuation by sector, Energy, Utilities, and Real Estate are slightly cheap; everything else, especially Industrials, are expensive. There is clearly not a bubble in valuation, though there could be one in earnings, which is why the CAPE valuation is so wide.
Source: J.P. Morgan Guide to the Markets
7. Earnings growth – Positive and improving.
Earnings growth is expected to continue to outpace its historical average by a wide margin. Estimates for 2026 continue to rise and growth is expected to accelerate significantly compared to the past several years. Margins have remained at peak levels and contributed more than ½ of EPS growth in 2026. Normally, this type of earnings growth is only seen when exiting a recession. Moreover, above-average growth is projected for 2027 and 2028 as well.
Source: J.P. Morgan Guide to the Markets
Big tech’s holdings of AI companies, e.g., OpenAI, Anthropic, SpaceX, have provided a significant, unsustainable boost to earnings:
Get Formidable News Direct to Your Inbox!
"*" indicates required fields
Check out our podcast Tea & Crumpets. Available on Apple Podcasts and Spotify.