

Adam Eagleston, CFA
CIO

Will Brown
CEO/Managing Partner
April 2025 Update: Road House
Part I – Summary
April 2025 Update: Road House
Markets have been beaten up to start 2025, especially as it relates to tariffs and government spending cuts, pronouncements from both the president himself as well as his various cabinet members are moving markets. What we have experienced has been unpredictable and violent, like the financial version of a bar-room brawl.
Key Takeaways:
- Nobody Ever Wins a Fight
- After outsized returns in 2024, cap-weighted indices like the S&P 500 and NASDAQ lagged to start 2025, suffering 10% or greater declines from the highs reached in February.
- Non-U.S. stocks, bonds, and commodities all posted positive returns, proving the merits of diversification.
- The average stock, especially in the NASDAQ and small-cap Russell 2000, has suffered a far larger decline than the index.
- Pain Don’t Hurt
- The biggest factor impacting markets at present is uncertainty regarding U.S. trade policy, e., tariffs.
- The correction we experienced in Q1 was roughly in-line with the average annual pullback for the S&P 500.
- Our take, congruent with that of the Fed and J.P. Morgan CEO Jamie Dimon, is that the near-term effects of tariffs are likely to be more uncertainty, slower economic growth, and higher inflation.
- Three Simple Rules
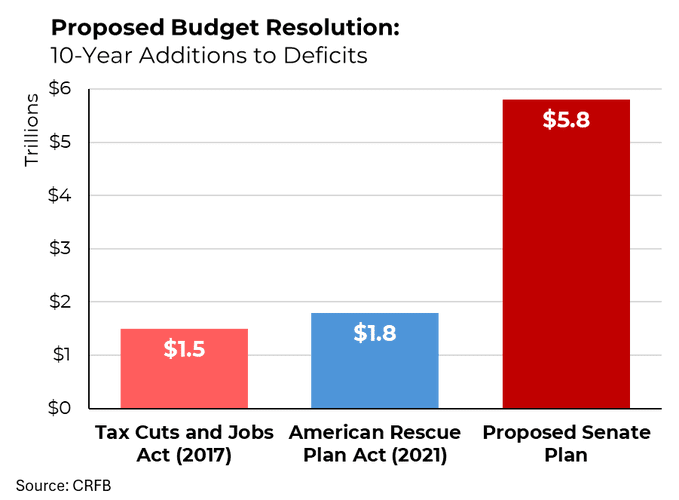
- The proposed tariffs, if implemented, would represent almost 1% of GDP, the biggest tax increase since 1982.
- While economists are increasing their recession probability forecasts, bond yields are increasing, an unwelcome development for borrowers, including the U.S. government.
- Despite the market’s decline, valuations are still elevated, and any softness in corporate earnings could see a double whammy (lower multiple on lower earnings).
For those who prefer not to read further, before you close the email, please know these three things.
- The current decline, which briefly entered bear market territory for the S&P 500, is now worse than the average annual decline.
- The biggest risk we see is a negative feedback loop, affecting corporate and consumer behavior, and tipping the economy into recession.
- Given the market’s (still) elevated valuation, avoiding a recession (and the accompanying decline in corporate earnings) is critical to prevent further declines.
Part II: Q1 2024 Recap –“Nobody ever wins a fight.” Dalton, Road House
“Trade wars are good, and easy to win.” Donald Trump, 2018.
As far as U.S. equity investors go, Dalton, a bouncer/philosophy major, played by Patrick Swayze in the original Road House, is right, at least so far; nobody is winning in this tariff fight between the U.S. and the rest of the world, based on the stock market reactions globally.
We would categorize the year-to-date declines through March 31 as being corrections for the S&P 500, NASDAQ, and Russell 2000, i.e., each has declined 10% or more from its all-time high.
| Index | YTD Return | Index Return from YTD Low |
Index Decline from YTD High |
Average Stock Decline |
|---|---|---|---|---|
| S&P 500 | -5% | 2% | -10% | -15% |
| NASDAQ | -10% | 0% | -14% | -35% |
| Russell 2000 | -10% | 1% | -14% | -28% |
| Dow Jones | -1% | 3% | -9% | -14% |
Source: Charles Schwab
However, looking at the far-right column of the above table, we see that the average stock within each of those indices has declined far more and would be considered in a bear market (down more than 20%).
While not all asset classes suffered in Q1, the start of Q2 has seen most everything move into the negative column. The equal-weight S&P Index was roughly flat in Q1, something we considered probable in our Q4 newsletter after two years of wide outperformance by the top-heavy market cap version of the S&P. Non-U.S. stocks were positive, as were bonds and commodities.
| Sector | 1-Month | 3-Month | 1-Year |
| Communication Services Select | -5.17 | -0.08 | 19.44 |
| Consumer Discretionary Select | -8.32 | -11.75 | 8.32 |
| Consumer Staples Select Sector | -1.18 | 4.44 | 9.72 |
| Energy Select Sector SPDR Fund | 3.48 | 9.94 | 2.19 |
| Financial Select Sector SPDR F | -4.20 | 3.43 | 20.09 |
| Health Care Select Sector SPDR | -1.58 | 6.54 | 0.42 |
| Industrial Select Sector SPDR | -3.57 | -0.22 | 5.59 |
| Materials Select Sector SPDR F | -2.68 | 2.67 | -5.66 |
| Real Estate Select Sector SPDR | -2.40 | 3.55 | 9.52 |
| Technology Select Sector SPDR | -8.29 | -11.05 | -0.17 |
| Utilities Select Sector SPDR F | 0.24 | 4.91 | 23.75 |
| S&P 500 INDEX | -5.63 | -4.28 | 8.23 |
Source: Bloomberg (as of most recent month end)
At the sector level, we have seen a reversal from 2024, with Consumer Discretionary and Technology stocks lagging so far in 2025, while Energy and Health Care have been the best:
| Sector | 1-Month | 3-Month | 1-Year |
| Vanguard Russell 1000 Value | -2.85 | 2.06 | 7.11 |
| Vanguard Russell 1000 Growth E | -8.44 | -10.05 | 7.67 |
| iShares Russell Mid-Cap Value | -3.72 | -2.26 | 2.09 |
| iShares Russell Mid-Cap Growth | -7.38 | -7.23 | 3.36 |
| iShares Russell 2000 Value ETF | -5.98 | -7.74 | -3.21 |
| iShares Russell 2000 Growth ET | -7.55 | -11.09 | -4.85 |
Source: Bloomberg (as of most recent month end)
Similarly, value stocks held their ground better than growth stocks in Q1, especially in large cap, something we mentioned as a likelihood in our January update, given the wide dispersion in favor of growth in 2023 and 2024:
Source: Bloomberg (as of most recent month end)
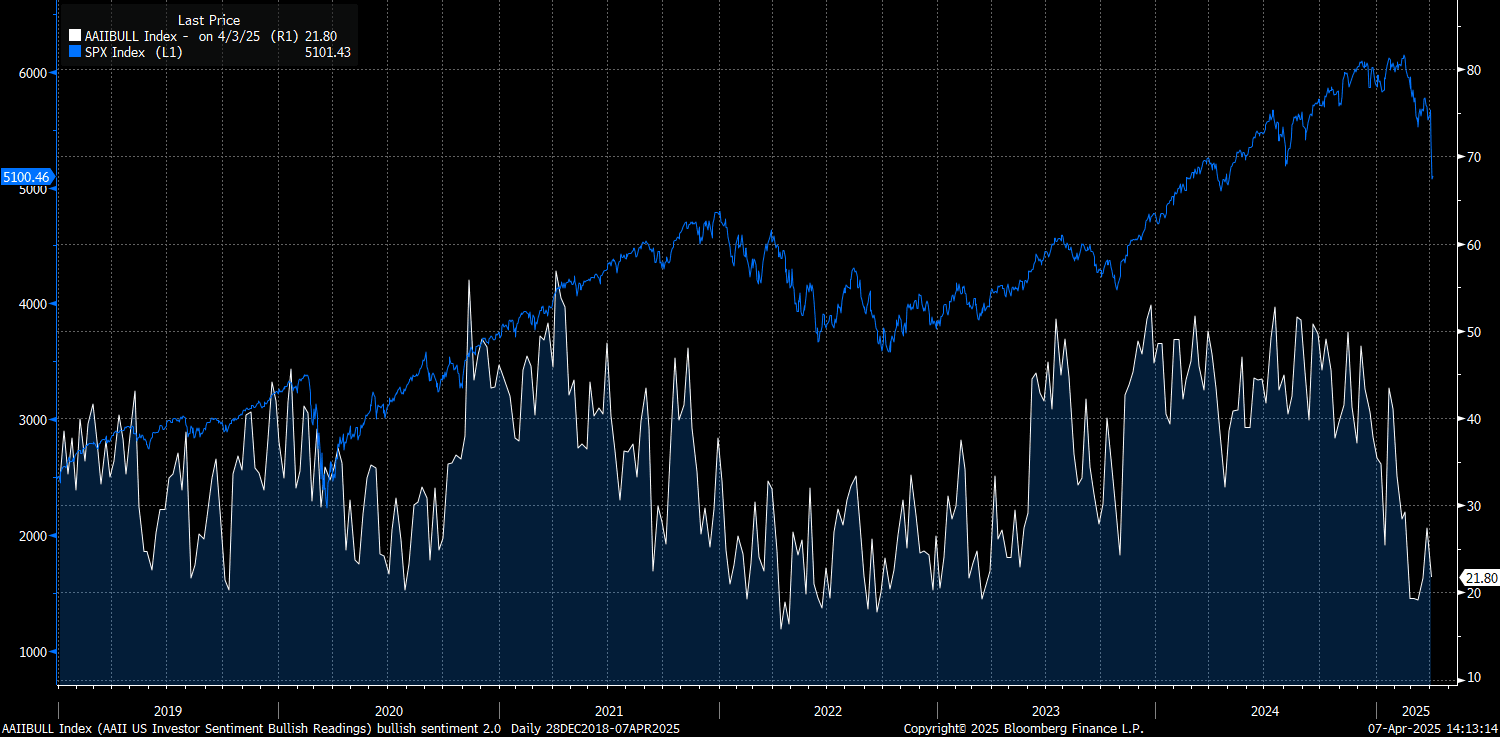
Retail investors are as pessimistic as they have been since 2022 as measured by this bullish sentiment indicator:
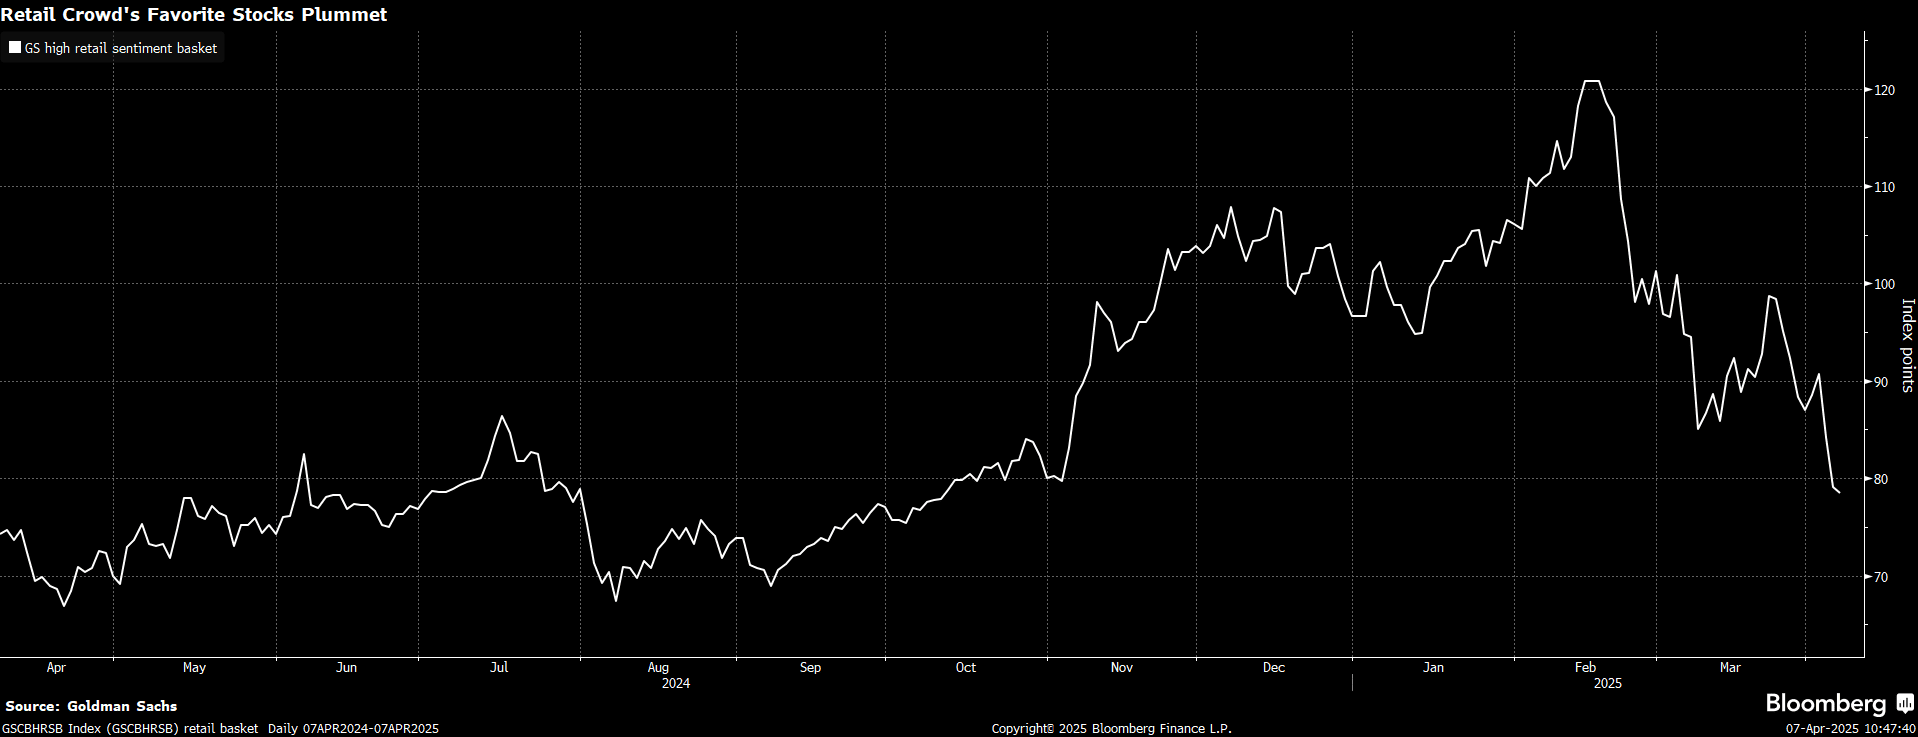
A major reason: retail investors’ favorite stocks are down far more than any index, losing almost 1/3 of their value in a little over six weeks:
For those who missed it, we wrote a From the Chair last week, and it is important to reiterate here that corrections are a normal part of being invested in the stock market. Historically, going back to 1980, stocks have averaged a 14% pullback each year, though the median is less than that.
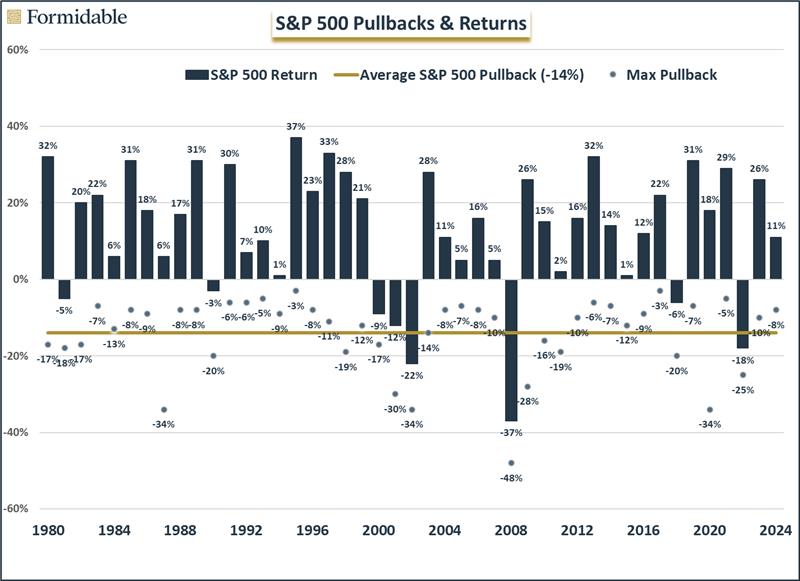
Source; JP Morgan, Bloomberg
Q2 and 2025 Outlook – Pain Don’t Hurt
“Donald Trump prescribes a dose of painful tariff ‘medicine’ as global markets wobble.” Economic Times Headline
Let’s get straight to it. Why are markets falling? It is, in no small part, due to this red line (estimated new average tariff rate) spiking (this was before the pause announced on April 9). However, as Ray Dalio of Bridgewater, one of the world’s largest hedge funds puts it, “At this moment, a huge amount of attention is being justifiably paid to the announced tariffs and their very big impacts on markets and economies while very little attention is being paid to the circumstances that caused them and the biggest disruptions that are likely still ahead.”
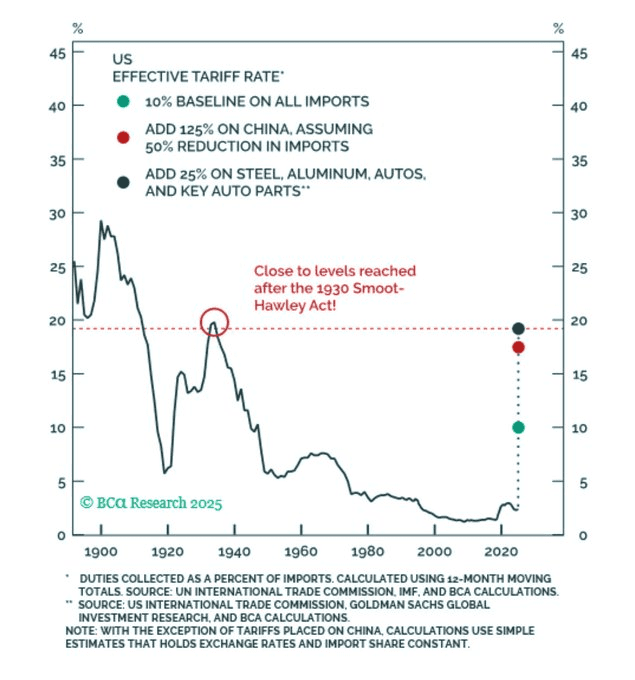
We will spend more time in the last section of the update looking at the potential effects (both short- and long-term). Prior to April 9th, the administration took a Zen-like, “pain don’t hurt” mindset. In other words, it viewed tariffs as necessary to achieve its stated economic and geopolitical objectives.
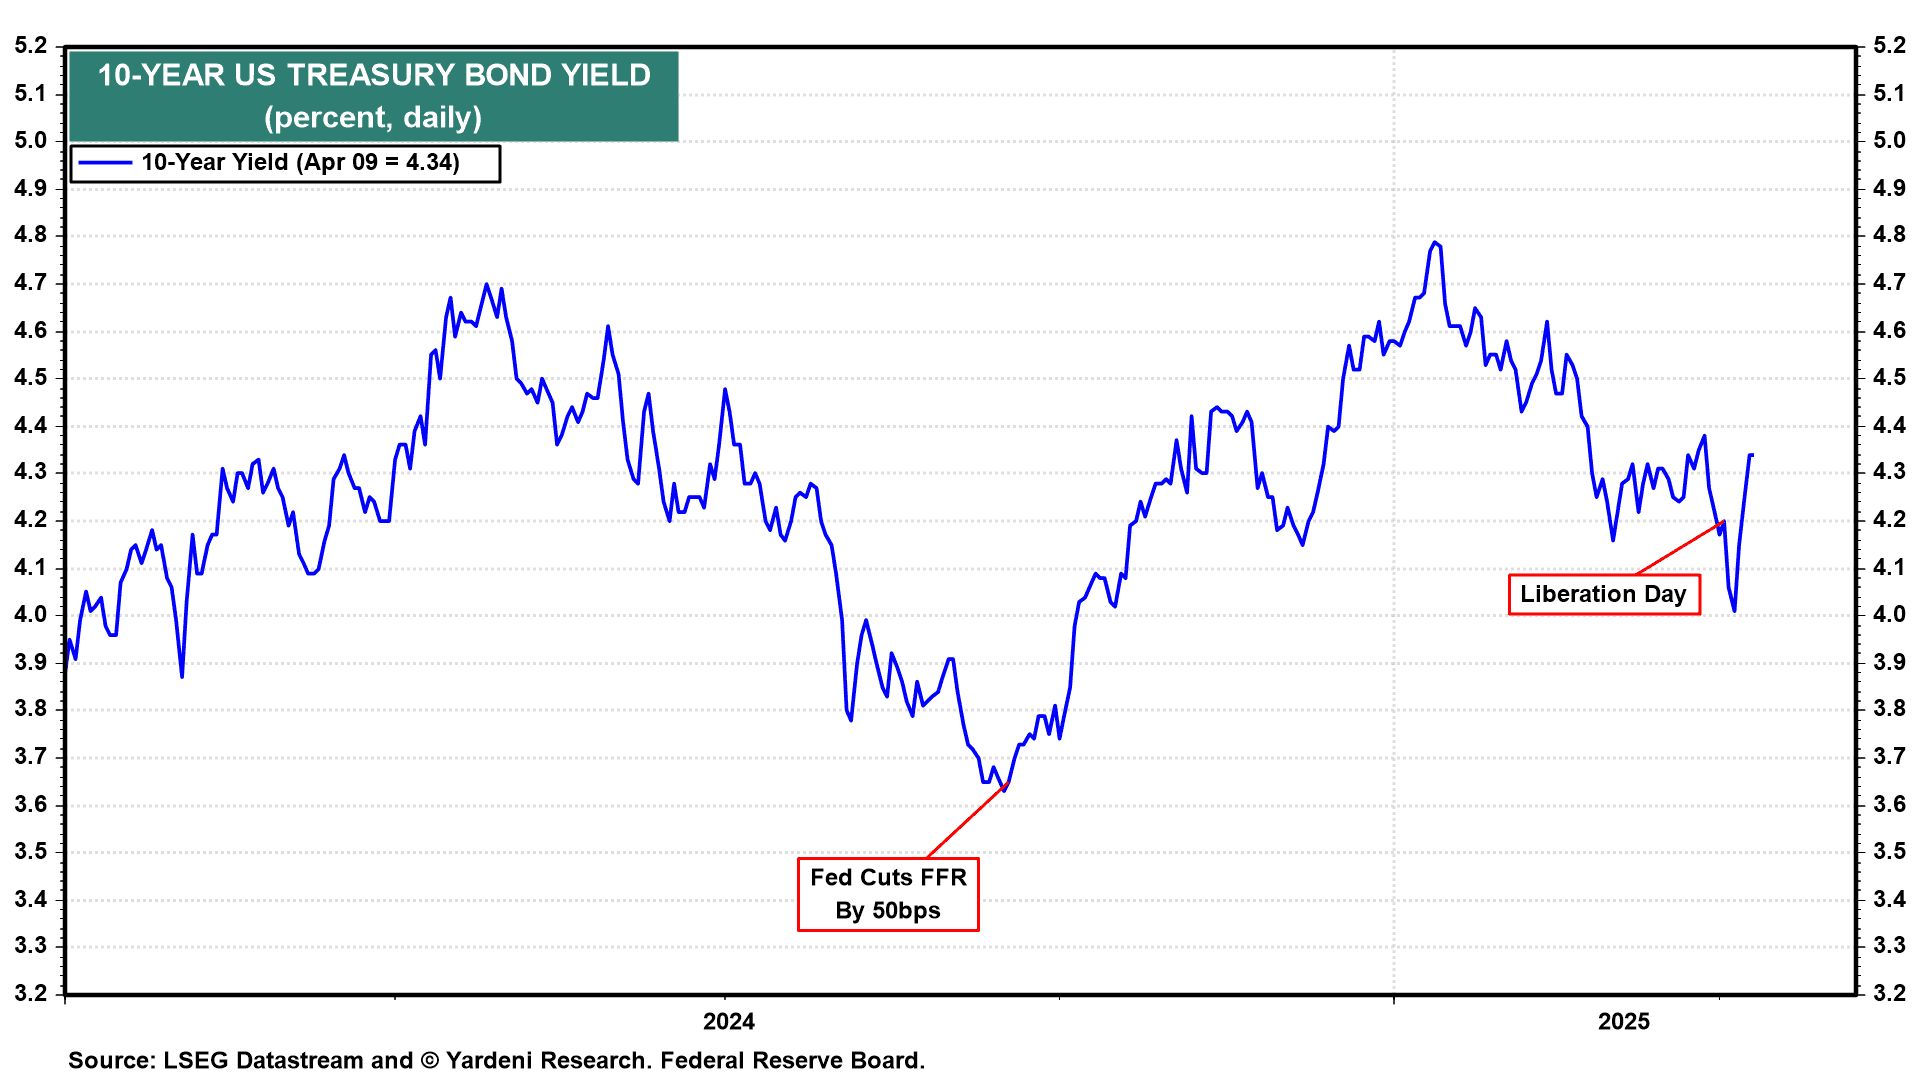
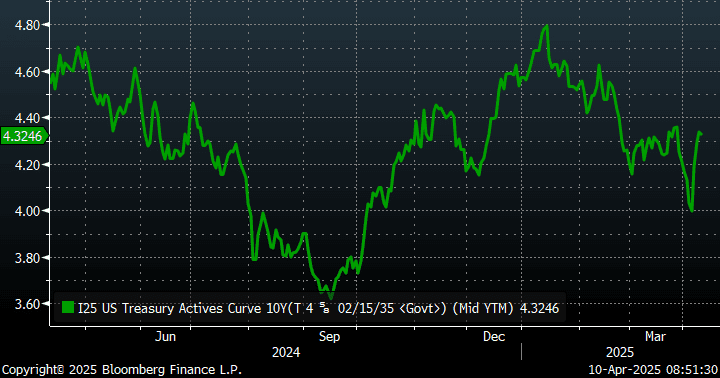
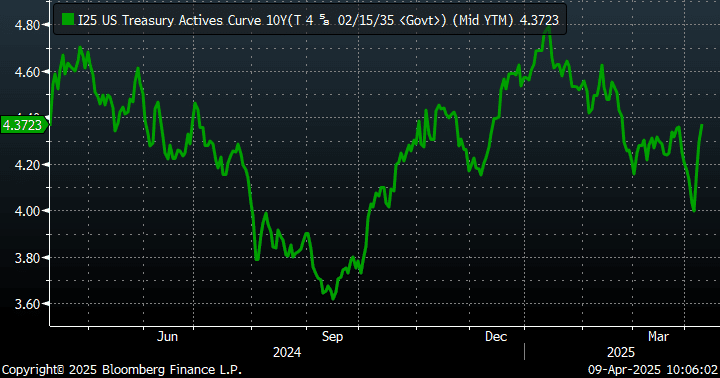
While that may have held true for the stock market, action in the bond market produced a level of pain that required walking back from the brink, i.e., a 90-day pause. Here is noted economist Ed Yardeni: “(T)he Bond Vigilantes have struck again. As far as we can tell, at least with respect to US financial markets, they are the only 1.000 hitters in history. Even though the Stock Vigilantes were clearly telling President Donald Trump that his tariff policy was misguided late last week, his advisers touted falling oil prices and bond yields as ultimately helping Main Street America. That changed as the 10-year Treasury yield surged 34 bps from below 4.0% on Friday to nearly 4.34%.” To paraphrase Dalton, the bond vigilantes decided it was time to not be nice.
In terms of the factors we track most closely, , GDP growth tilted a lot more negatively, tilting our earnings growth forecast into the deteriorating camp. As Darius Dale of 42 Macro puts it, “S&P 500 Q1 earnings growth is now seen at 6.7%, down from 11.1% when Trump won the election in November. Full-year 2025 projections have dropped to 9.4% from 12.5%. Why earnings would grow at all in 2025 is a question that investor consensus has yet to seriously entertain.”
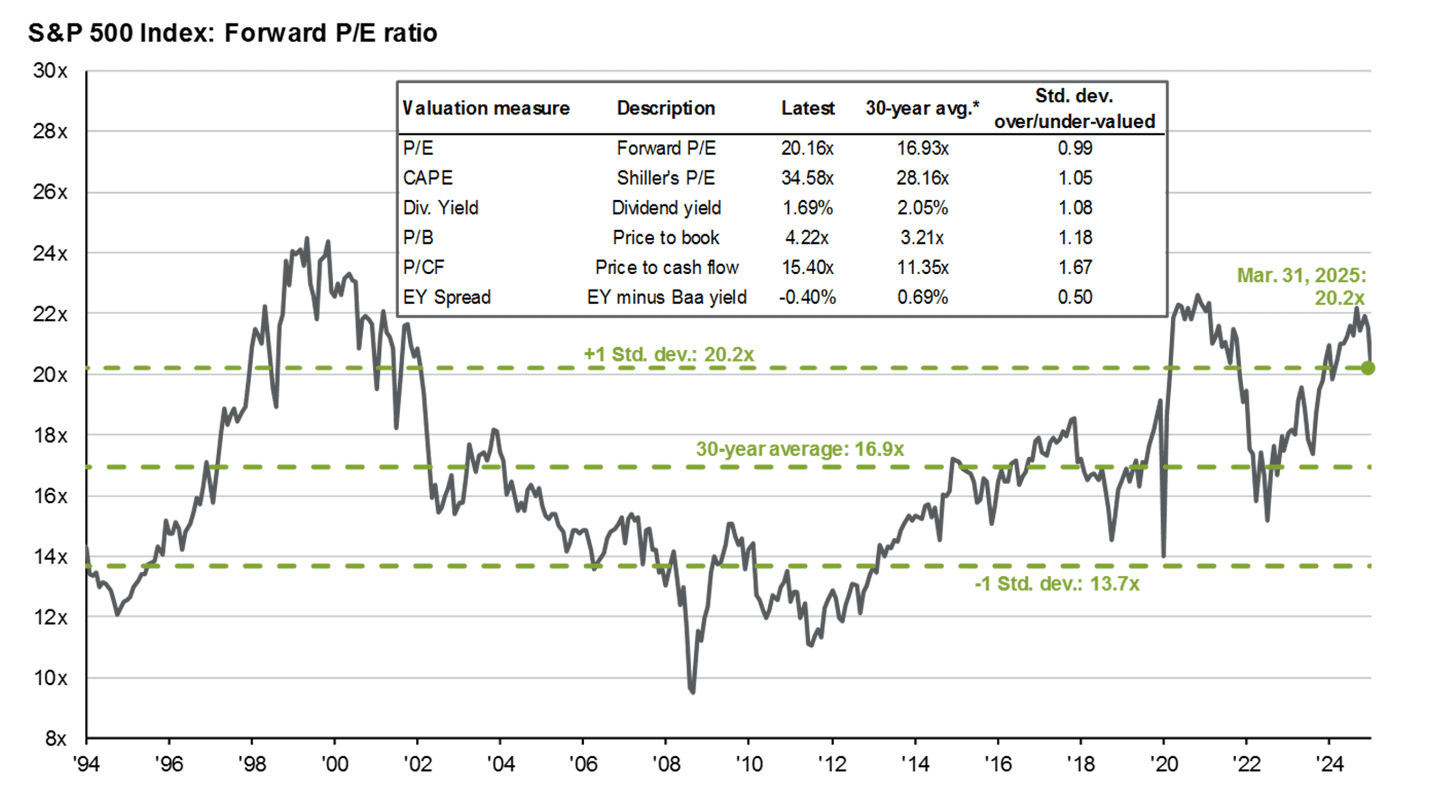
Conversely, interest rates and stock multiples both improved, albeit only to the point where they are edging toward neutral; the S&P 500 remains historically expensive almost any way you look at, even if you exclude the Magnificent Seven.
For more details on all the factors, click here.
| More Negative | Neutral | More Positive | |||
| Inflation | ≈ | ||||
| GDP Growth | ← | ||||
| Fed Policy | ≈ | ||||
| Interest Rates | → | ||||
| Credit Spreads | ≈ | ||||
| Stock Multiples | → | ||||
| Earnings Growth | ← | ||||
| Deteriorating | ← | ||||
| Stable | ≈ | ||||
| Improving | → | ||||
Conclusion – Three Simple Rules
“All you have to do is follow three simple rules. One, never underestimate your opponent. Expect the unexpected. Two, take it outside. Never start anything inside the bar unless it’s absolutely necessary. And three, be nice.” Dalton, Road House
“The world in which we live has an increasing number of feedback loops, causing events to be the cause of more events.” Nasim Taleb, The Black Swan
The administration is taking a markedly different approach to what Dalton recommends. Whether it works or not is to be determined, but we are mindful of Taleb’s feedback loop comments and how tariffs might be an event causing other events.
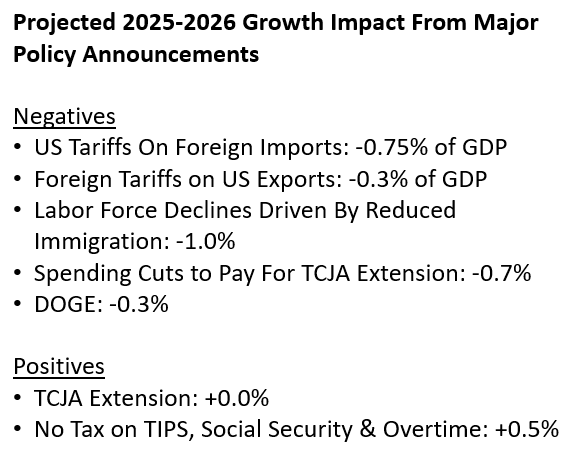
Per First Trust, “(A)ccording to the Tax Foundation, the Trump tariffs – those recently announced plus those already implemented – would raise revenue by 0.85% of GDP, making them the largest peacetime tax increase since 1982.” Who pays these tariffs is a matter for political debate outside the scope of this update, but let’s just say a large tax hike is a headwind to economic growth.
On the flip side, a massive tax cut is being bandied about. What is the net effect of these factors combined? Approximately negative 2.5% according to sources (see GDP growth section), which makes the bounce in the 10-year U.S. Treasury yield from 4% up to 4.32% surprising and concerning. This is an unanticipated effect in the feedback loop, and an unwelcome event for any borrower, be it someone looking at mortgages or the U.S. government, which needs to refinance around $9 trillion this year.
What we do know is a key adversary as seen by the administration is China, and in the events causing events camp, we have this from Reuters: “(W)ashington last week imposed import tariffs of at least 10% on almost the entire world, and much higher levies on countries such as Vietnam, where Chinese factories have been shifting production. This drew retaliation from China, followed by new threats of escalation from U.S. President Donald Trump.” The entire article is worth a read in terms of framing China’s policy choices. While no country buys more from China than the U.S. (around 14% of China’s exports), the Chinese can retaliate (remember rule one: never underestimate your opponent).
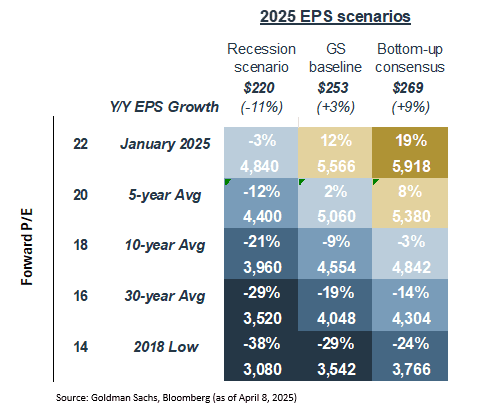
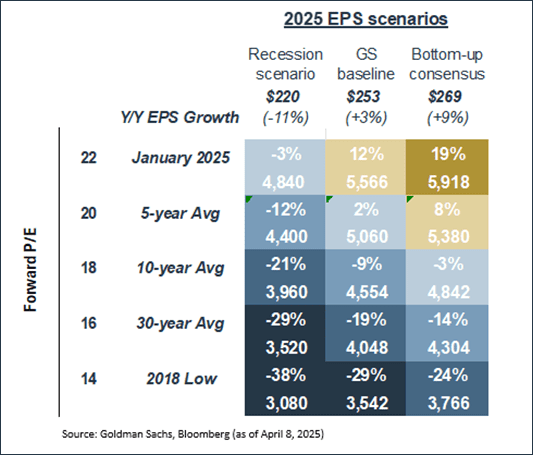
We also know that, given current valuations, avoiding a recession (and the decline in corporate earnings that typically accompanies one) is of paramount importance. Based on data as of the close on April 9, 2025 (the S&P 500 closed at 5,457 after a historically large increase after the tariff pause was announced), following are the upside and downside for the S&P 500 at various valuation levels under three scenarios (recession, baseline Goldman estimates, bottom-up analyst estimates). The key takeaway is that risk is skewed to the downside if earnings disappoint or valuations revert toward longer-term averages.
As mentioned, Patrick Swayze played Dalton in the original Road House. The 2024 remake of Road House saw Jake Gyllenhaal in the role. The two appeared together in cult classic Donnie Darko, which is about the possibility of alternate timelines and how events can change. No timeline is like the one we are traveling, but historically, the U.S. analogs for sharp increases in tariffs have not been great.
- Tariff Act of 1890, a.k.a. the McKinley Tariff (he was a member of the House of Representatives at the time), is cited as a contributing factor to the Panic of 1893. While President Trump often cites the success of McKinley during his time in the White House, he did not take office until 1897 and benefitted from the recovery from the Panic.
- Tariff Act of 1930, a.k.a., Smoot-Hawley Tariff Act. This is the best summary.
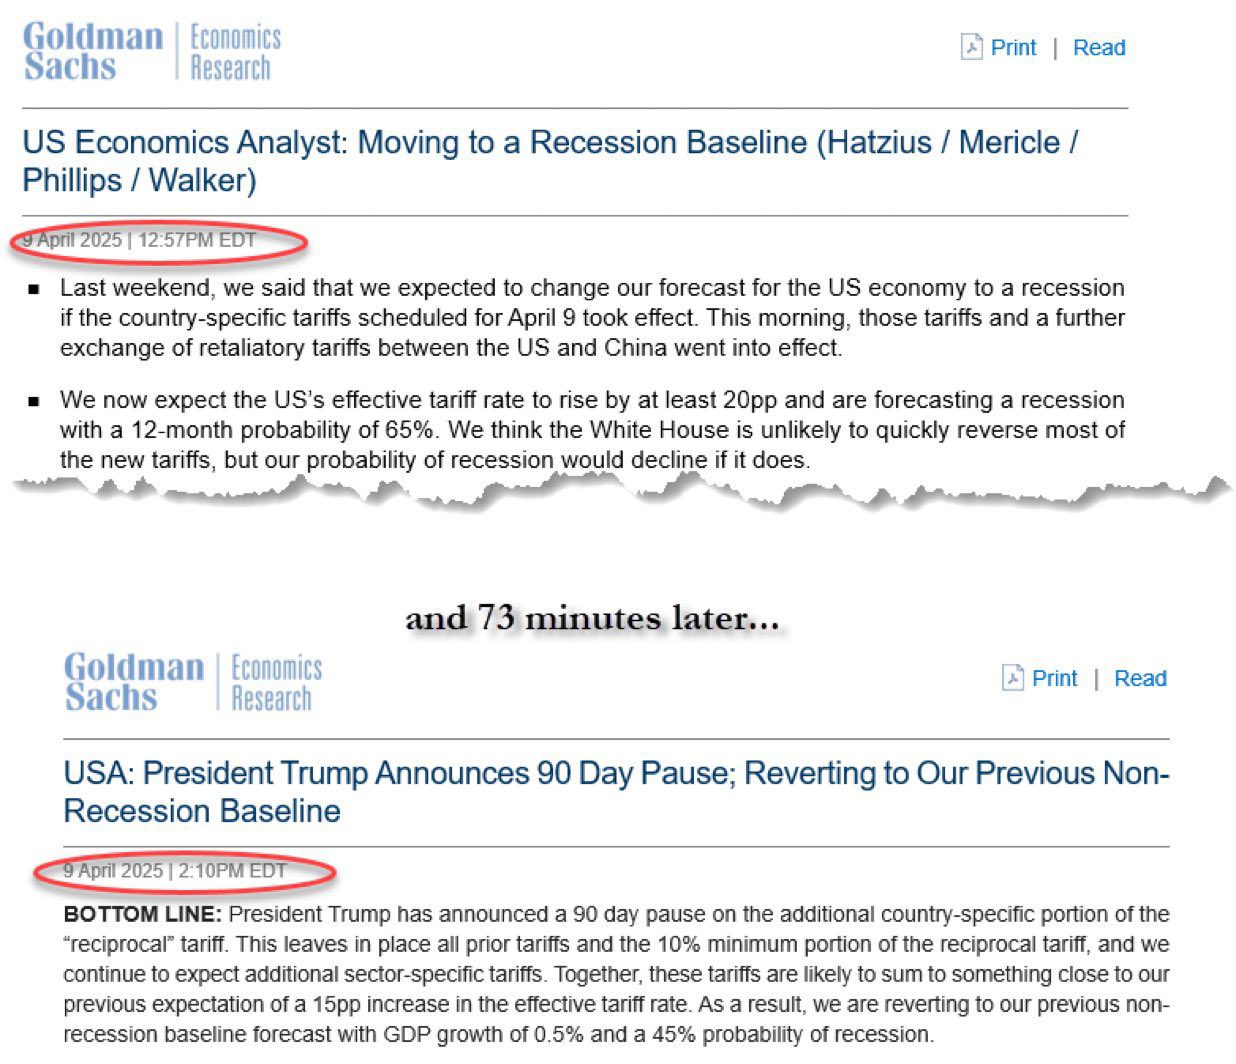
Goldman Sachs, in response to the 90-day pause, lowered its recession odds from 65% to 45%, albeit with a very paltry 0.5% GDP growth forecast. That seems reasonable to us. However, the equity market responded as though this pause reflected the end of the trade war and a return toward the status quo; we do not think that it is anywhere close to a certainty.
As Donnie Darko states, “destruction is a form of creation. So the fact that they burn the money is ironic. They just want to see what happens when they tear the world apart. They want to change things.” Or, as Secretary Bessent just stated, “but for the next four years, the Trump agenda is focused on Main Street. It’s Main Street’s turn. It’s Main Street’s turn to hire workers. It’s Main Street’s turn to drive investment, and it’s Main Street’s turn to restore the American Dream.”
To be blunt, neither Wall Street nor main Street benefit from a recession. Typically, stocks would see their multiples fall in a recession, which introduces more downside. Our hope is that earnings come in somewhere in positive territory, we get a modicum of certainty around tariffs and offsetting fiscal policy, i.e., tax cuts, and investors decide 18-20x P/E is a fair price to pay. In that scenario, we think our process of focusing on stocks with an attractive combination of shareholder yield (dividends plus buybacks), growth, and reasonable valuation, might allow us to exceed what the index may offer. In a less hopeful situation, i.e., an all-out trade war, our emphasis on quality and diversification may help protect in a more significant decline.
Part III: In-depth analysis of Key Factors
- Inflation – Negative but stable. In recapping March’s consumer price reading, Mike Ashton stated, “the bottom line is that the inflation figures look to be converging on 3.5% or so, before the effects of tariffs kick in.” The Core Personal Consumption Expenditures data preferred by the Fed was 0.4%, the highest since January 2024; this would put annualized inflation near 5%.
On April 4th, Chair Powell stated, “We face a highly uncertain outlook with elevated risks of both higher unemployment and higher inflation.” However, March CPI data showed only a 2.8% annual increase, the smallest rise in four years.
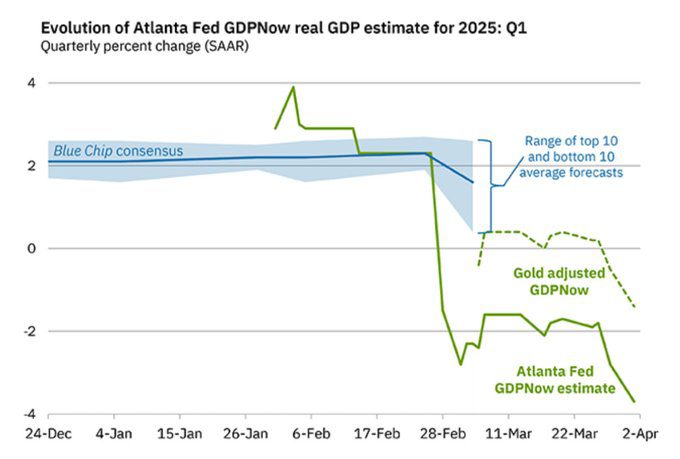
- GDP Growth – Negative and deteriorating. The Atlanta Fed’s volatile GDPNow estimate for Q1 has fallen sharply. The data has been skewed by gold imports, for which the Fed is now adjusting, as well as an increase in other imports to get ahead of tariffs. While this could snap back, given the way the figure is calculated, the more concerning data is on job cuts, which have spiked.
In his letter to shareholders, Jamie Dimon states, “Whether or not the menu of tariffs causes a recession remains in question, but it will slow down growth.” Here is how economists are quantifying the net effects of current trade and fiscal proposals.
- Fed Policy – Negative but stable. The Fed does not meet again until May. Currently, the market is anticipating between three and four rate cuts this year. Despite President Trump’s calls for rate cuts sooner rather than later, Chair Powell’s recent comments indicate more of a wait-and-see approach since, as he stated, “uncertainty is high,” early contender for understatement of the year.
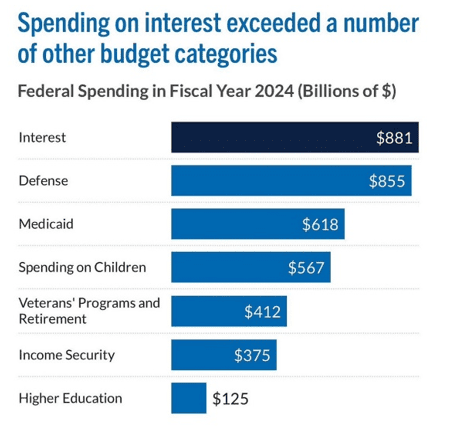
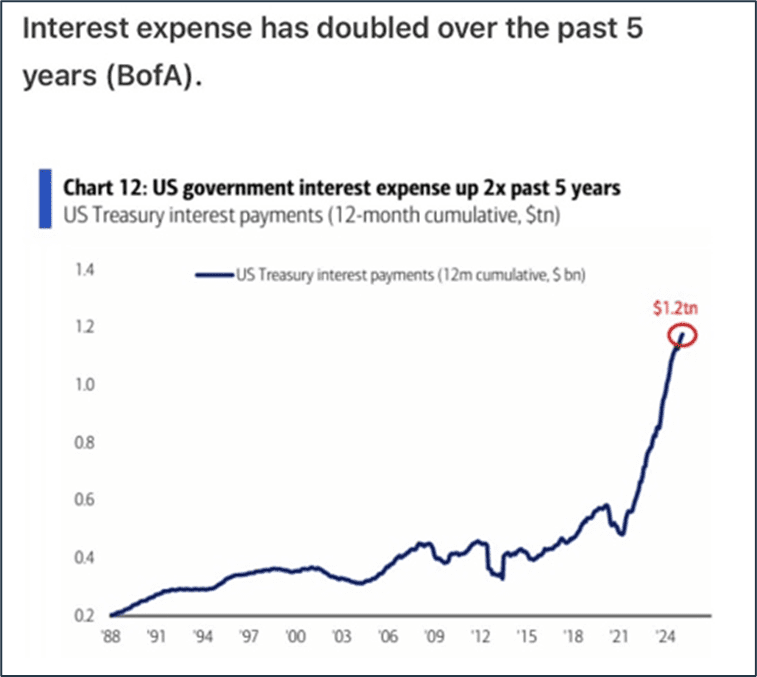
- Interest rates – Negative but improving. The silver lining of the increased concerns over the effect of tariffs on economic growth is a lower 10-year yield, though the recent V-shaped bounce cannot be making life easier for the administration. Given that this rate drives what Americans pay in terms of mortgages, a sustained decline here is necessary, both to unlock housing and refinance the wall of debt maturing this year. With the current interest expense the largest line item in the government’s budget, the Treasury needs lower rates, though the appetite of foreign buyers may be tested given the impact of tariffs and a ballooning level of debt.
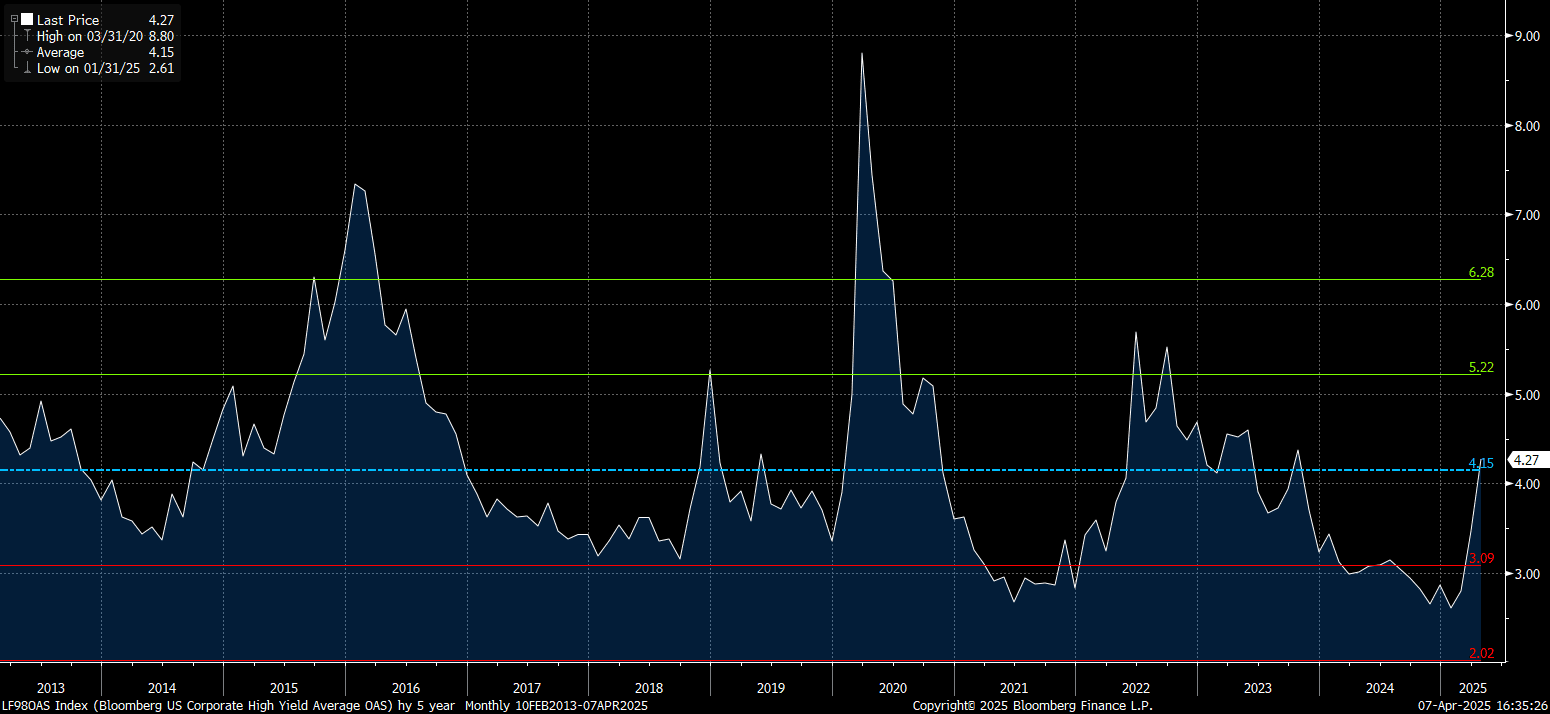
- Credit spreads – Negative but stable. A reminder we use this as a contrarian indicator. In other words, if we see spreads widening into the area above the green line, we may start to view risk/reward more favorably. While high-yield spreads and investment grade spreads have widened they are now just in-line with their long-term average.
- Stock multiples – Negative but improving. Interesting, the only valuations that have come down were at the top of the index; the remaining 490 stocks are roughly where they were at the start of the year. Both remain above their longer-term averages.
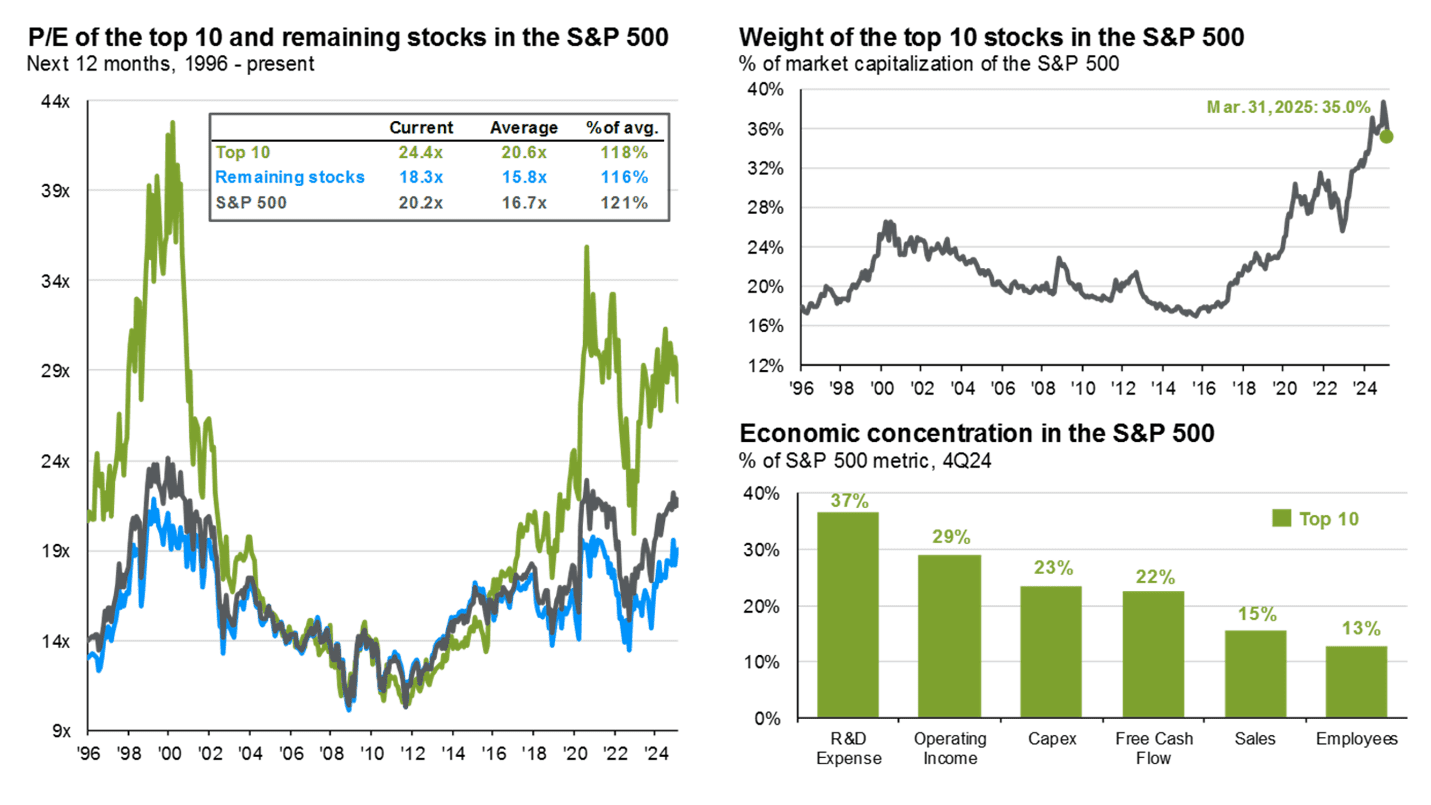
Source: J.P. Morgan
- Earnings growth – Negative and deteriorating. As goes GDP, so go earnings. It is hard to envision a scenario where the other 493, i.e., the S&P outside the Magnificent Seven, grow earnings at twice the rate of 2024 if slowing economic growth (as predicted by Jamie Dimon) or a recession (per the Atlanta Fed) occurs. On the other hand, 17% growth for the Mag 7 (versus 40% in 2024) seems ambitious but possible.
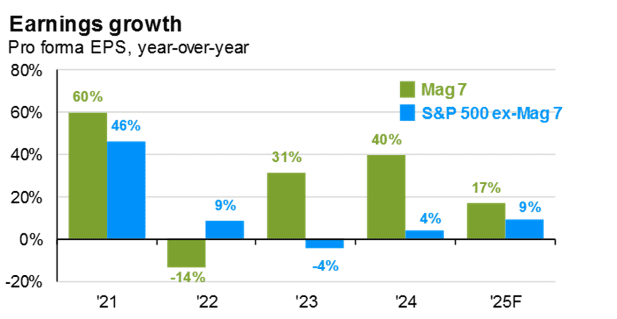
Source: J.P. Morgan
READY TO TALK?