

Adam Eagleston, CFA
CIO

Will Brown
CEO/Managing Partner
April 2025 Update: Slow Moving Shipping Wreck
Slow Moving Shipping Wreck
A few years ago, I chaperoned our daughter on a trip to the National Maritime Museum of the Gulf of Mexico (I guess America, now…) One of the exhibits simulated steering a barge into the port of Mobile, which is quite difficult, especially when surrounded by screaming children.
One thing I learned was this; if you make a really sharp turn while steering, there is literally no way you can fix it. No course correction, no reverse, nothing; you just have to wait a while before the inevitable crash into the shore.
Which brings us to tariffs. Our job here is not to debate whether the administration should or should not be pursuing the imposition of tariffs on the rest of the world, especially China, but just to look at the logistics of what is happening in real time. Our perspective here is a little different as due to our exposure to the logistics industry we follow quite a few sources of alternative data related to freight and shipping.
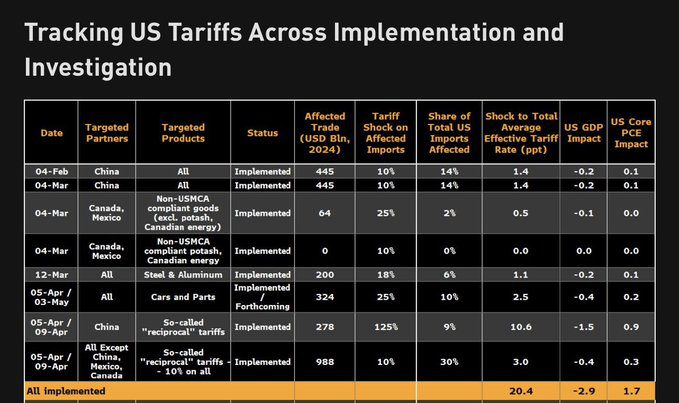
Here is a comprehensive timeline of what has happened so far (starting from “Liberation Day”, i.e., April 2, 2025); the following focuses on the tariffs that the U.S. is imposing on China:
- April 2 – The White House issues an executive order and fact sheet declaring a national emergency and invoking the International Emergency Economic Powers Act (IEEPA) to impose a baseline 10 percent tariff starting April 5, 2025, on virtually all countries and then additional “reciprocal” tariffs starting April 9, 2025, on countries that contribute to large, persistent US trade deficits.
- April 8 – The White House amends the April 2 executive order to counter-retaliate by imposing an additional 50 percent tariff on imports from China because of China’s 34 percent tariff retaliation announced April 4. This brings the total US tariff increase on imports from China associated with the original April 2 announcement to 84 percent (with sectoral carve-outs) in addition to the 20 percent (no sectoral carve-outs) of February 4 and March 4.
- April 9 – After the tariffs have gone into effect, President Trump posts on Truth Social that differential tariffs on trade surplus countries announced April 2 will be paused for 90 days. However, the 10 percent tariffs on nearly all countries will remain in effect. Because it retaliated, China will now also face a higher tariff of 125 percent, and not the combined 84 percent of the April 2 and April 8 executive orders.
- April 10 – US sudden tariff changes announced April 9 go into effect.
Even though April 10 is when tariffs went into effect, it is going to take a longer time to see the ramifications, just as in our barge simulator example. For some context, around seven (7) million Americans work in warehousing and transportation.
- Ports – As we can see in the graphic below, container ship volumes are falling precipitously (Source – Port of Los Angeles).
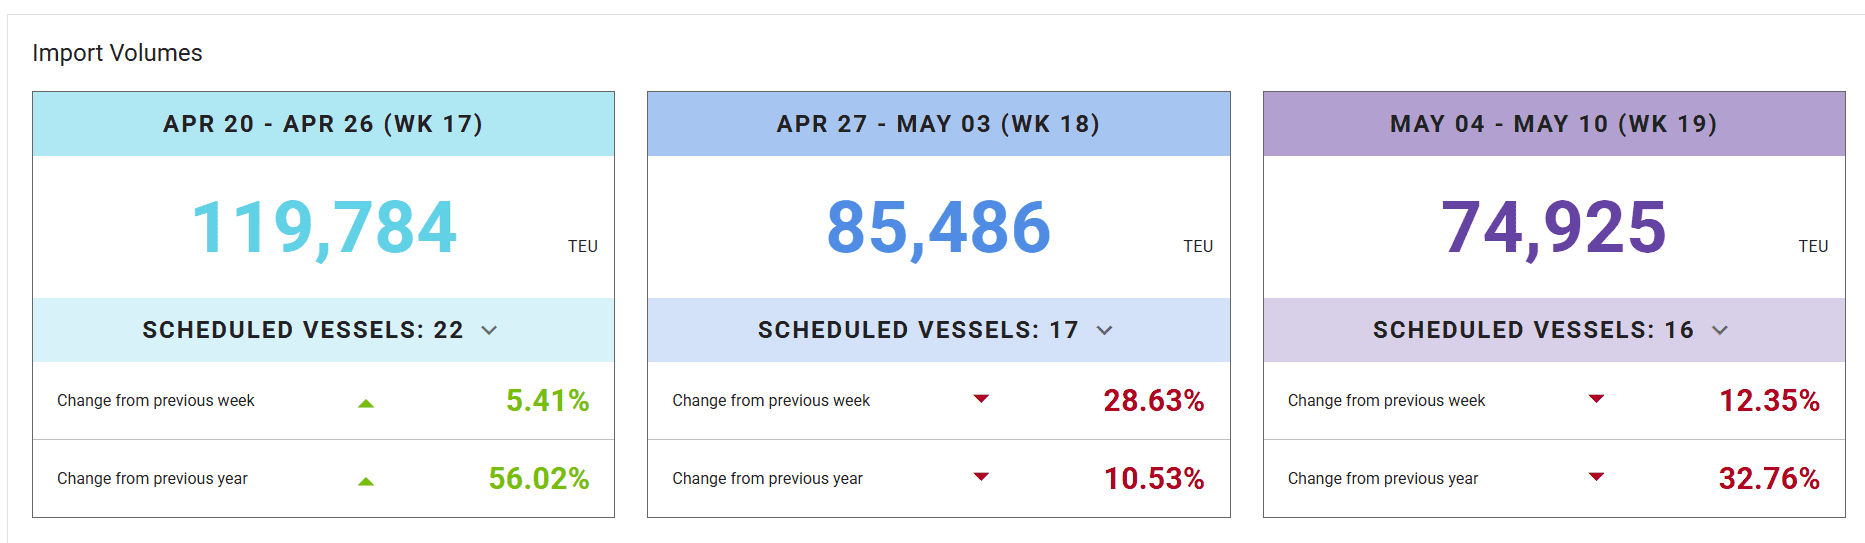
It takes around 30 days for a container ship to reach Los Angeles from China; Houston is 45 days and New York is 55 days. This decline will have significant effects on the economy (and consumers), but not immediately.
- Warehouses – Containers often go from ports to warehouses. Fewer containers mean fewer employees needed to unload them at the warehouse. As you see in the graphic above, we saw an initial spike in import volumes as importers tried to get in front of tariffs, but the out weeks show sharp year-over-year declines.
- Trucking – Trucks take goods from warehouses to retailers. According to Craig Fuller at FreightAlley, we may see a further 50% drop in the coming weeks in the absence of a resolution, which would mean sizable layoffs in trucking.
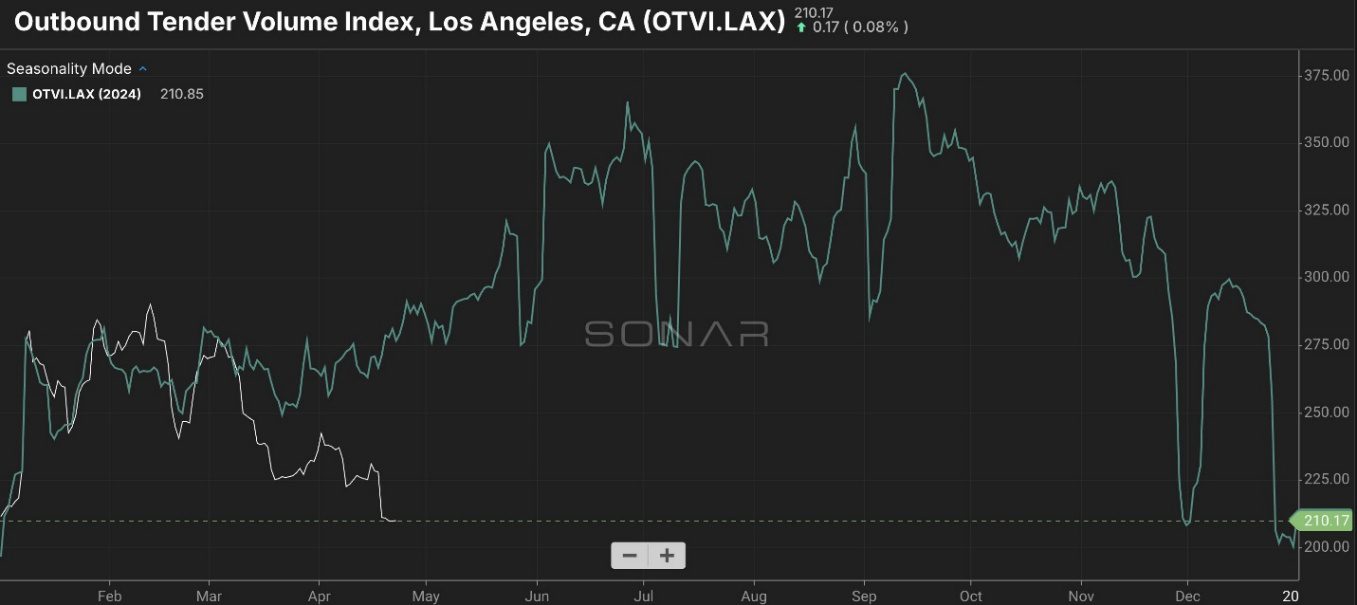
The bright blue line in the chart below indicates 2020, i.e., Covid, and we are headed in that direction.
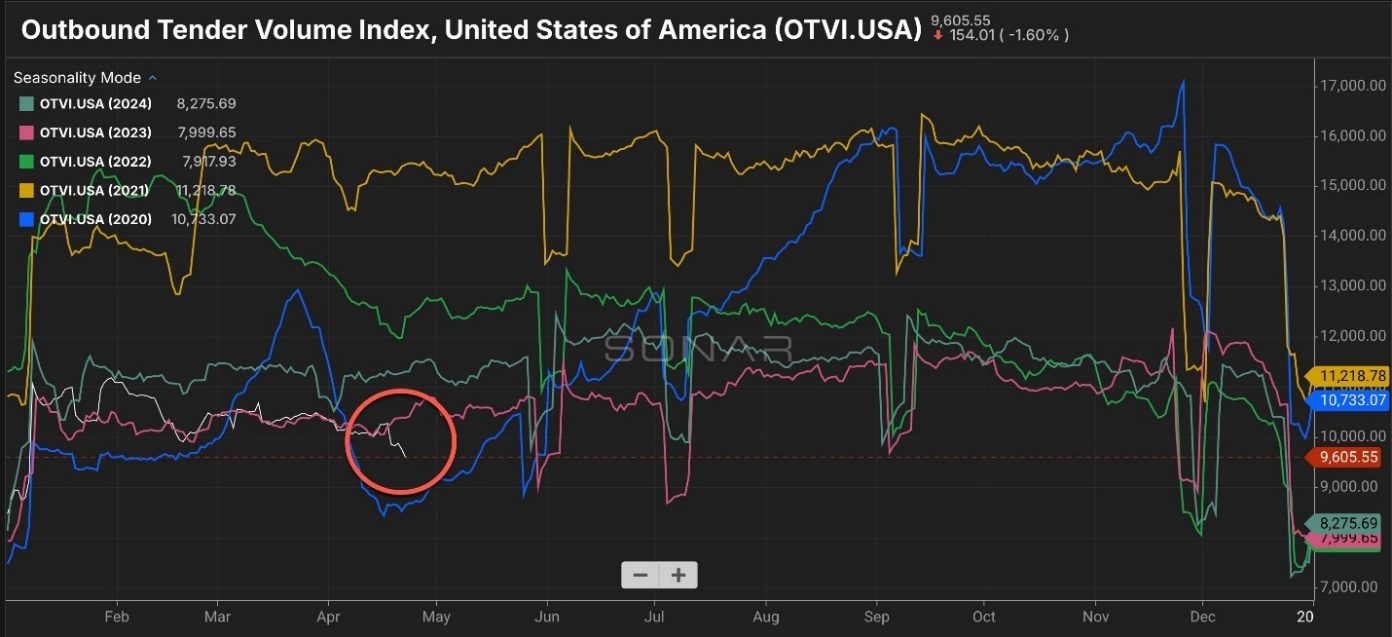
Old Dominion Freight Lines stated on its recent earnings call, “We anticipate that our revenue per day for the full month of April will decrease ~6%.” And this is before the tariff impact really starts to hit.
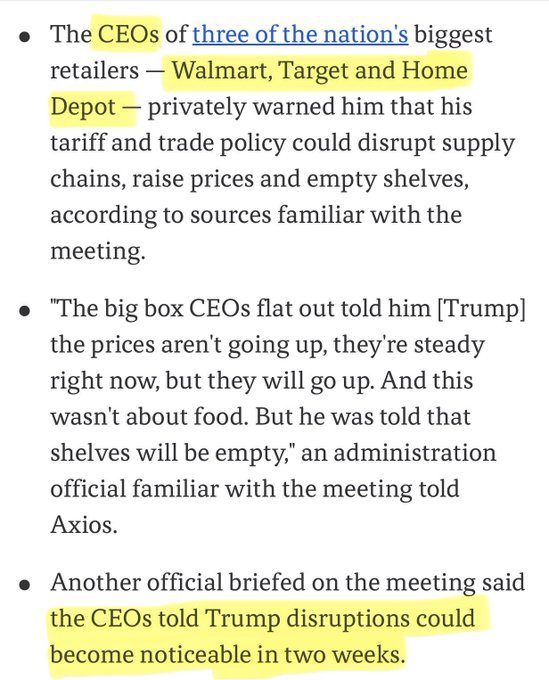
- Retail – President Trump met with several retail CEOs this week. They raised concerns over rising prices and empty shelves. The U.S. imported almost $440 billion from China in 2024; those goods sell at retail for $2 trillion, according to Flexport.
So far, despite overtures from the administration seeking de-escalation, the response from China has been, “completely cancel all unilateral tariff measures” if you want talks. That makes it seem like we may not be closing in on a deal. As a reminder, from an administrative perspective, trade deals historically have taken considerable time to negotiate. For example, negotiations for the USMCA (US-Mexico-Canada Agreement) from the first Trump administration began in 2017; USMCA was not signed into law until 2020.
The point here is that even if de-escalation or agreement happened before the 90-day pause ends in July, we would still be looking at months of depressed shipping and trucking activity, and that is assuming that factories in China come back online immediately. Covid taught us that once supply chains are interrupted, it is tough to return to “normal.” I am sure we all remember the “transitory” supply chain inflation from 2021.
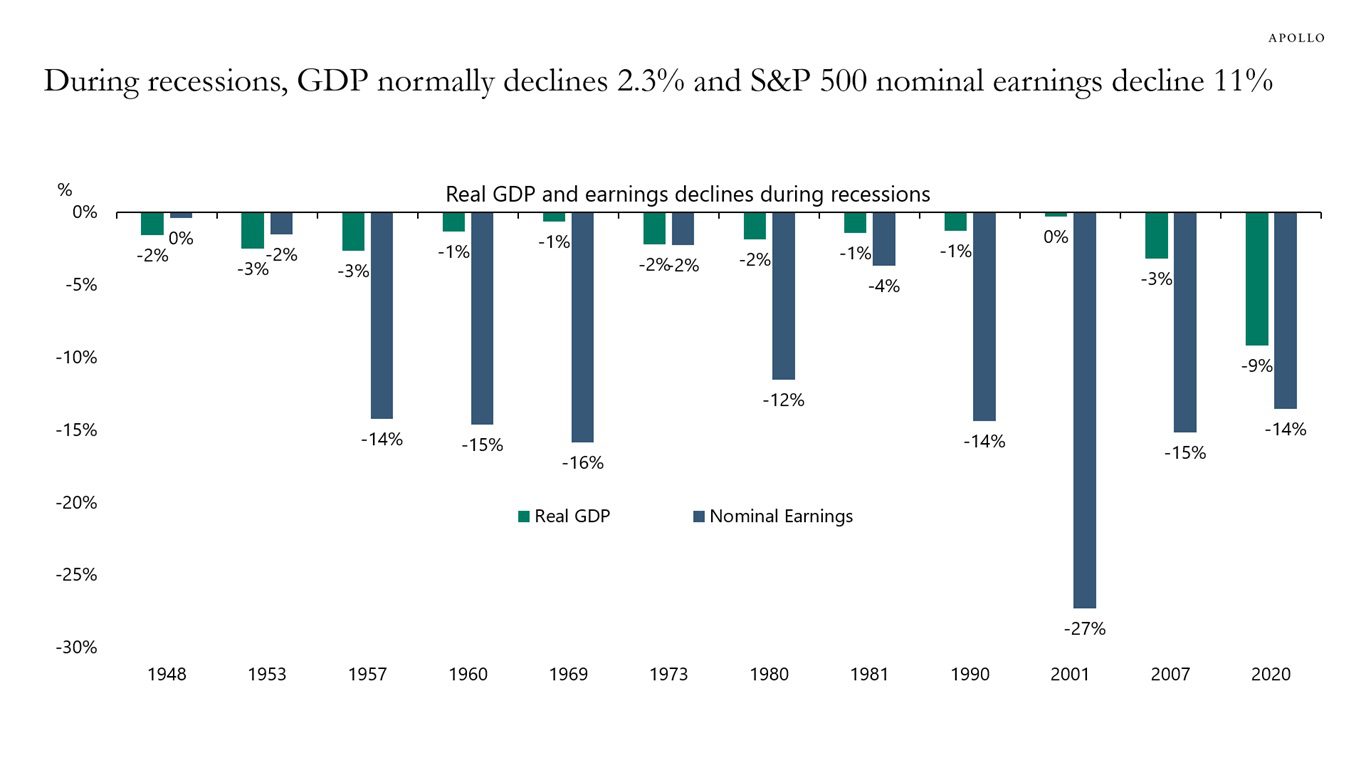
While we are grateful that the stock market has recovered almost all of its post-Liberation Day losses, it is important to remember that while the positive reaction to headlines is immediate (and welcome), the near-term impact of tariffs on the real economy, as we are seeing flow through the logistics sector, is another. Projections show a close to 3% expected hit to the economy, i.e., gross domestic product (GDP), for this year:
If the hit to GDP is anywhere close to this level, earnings will likely decline. Historically, since World War II, the average recession is a 2.3% decline in GDP, and an 11% decline in earnings for the S&P 500. However, the range of outcomes is wide. During the 12 post-war recessions, earnings were:
- Flat or down less than 5% four times
- Down between 5% and 15% for times
- Down 15% or more four times
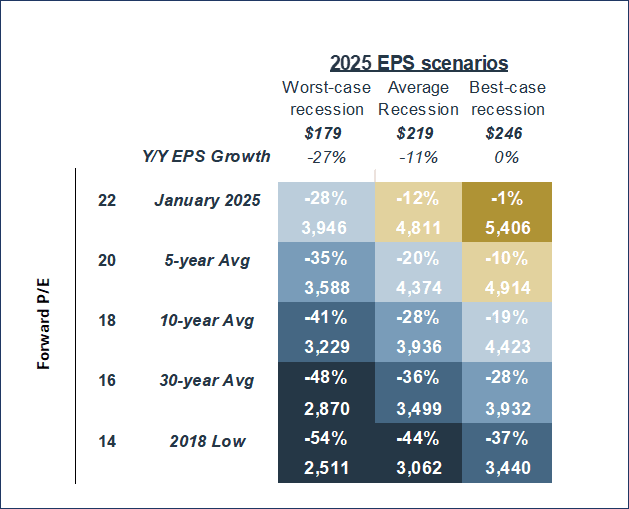
In the event of a recession, here is how our model for S&P 500 price levels looks, assuming worst-case (-27% as tech bubble unwound), base case (-11% average decline), and best-case (0% decline in 1948) scenarios for earnings declines at various P/E levels:
A recession is still not the base case for most economists, though they have been increasing the odds of a recession and concomitantly reducing expected growth. Per Bloomberg, “The US economy is set to expand 1.4% in 2025 and 1.5% in 2026, according to the latest Bloomberg survey of economists, compared with 2% and 1.9% in last month’s poll. The median respondent now sees a 45% chance of a downturn in the next 12 months, up from 30% in March.”
From our perspective at the helm, the risks seem skewed to the downside. However, just like steering a barge, making sharp turns with your portfolio can also lead to bad outcomes. We are here to help you navigate these turbulent crosscurrents.
READY TO TALK?