

Adam Eagleston, CFA
Chief Investment Officer
The weather has just now started to reach consistent levels of freezing temperatures, so hopefully soon we will introduce our children to the joys of skiing.
Key Takeaways:
Green – Investors expect the Fed to take rates lower on the bunny slope.
- Expectations are for at least six 25 basis point rates cuts by the Fed in 2024.
- Markets turned increasingly green as interest rates declined.
- With almost all indices in the green, investor greed hit highs, too.
Blue – Intermediate-term bonds ended the year about where they began.
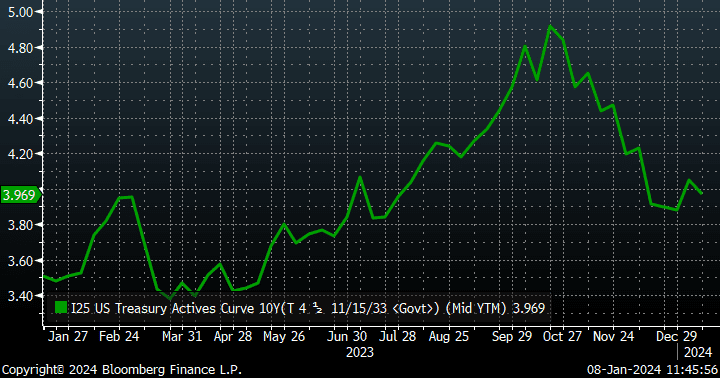
- After reaching almost 5% in October, the benchmark 10-year Treasury ended the year at 3.88%.
- Credit premiums for investment grade and high-yield bonds also declined.
- Most investors are convinced that the Fed has achieved a soft landing for the economy.
Black Diamond – Challenges remain top of mind for us as we enter 2024.
- Stocks have declined modestly to start 2024 as yields have taken the chairlift higher.
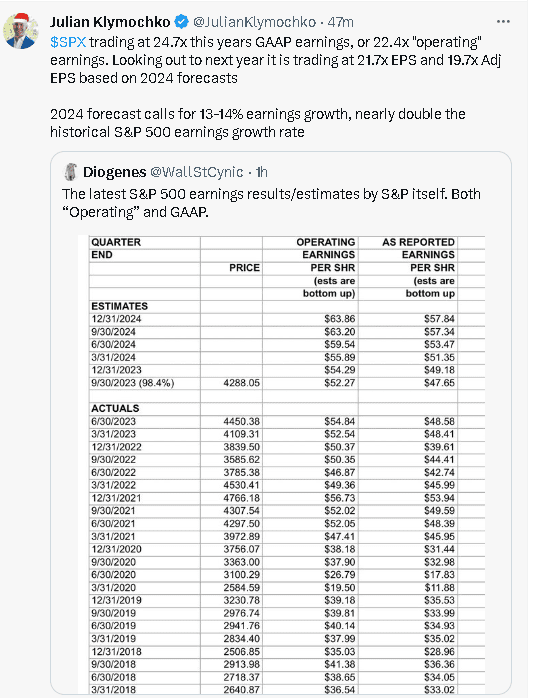
- However, valuations remain elevated and earnings expectations for 2024 are nearly double their historical growth rate.
- We believe opportunities for disappointment abound and are focused on taking the safest, not the steepest, path.
Know these three things:
- 1The level of concentration in the S&P 500 is the largest it has been since the 1960s “Nifty Fifty” era, exceeding even the tech bubble.
- 2Market expectations currently call for 12% earnings growth for the S&P 500 and six (6) Fed rate cuts. We think one or the other could happen, but this combination is highly unlikely and has zero historical precedent.
- 3The VIX index, a proxy for market fear, is at its lowest level since the pandemic, as is bearish sentiment, i.e., there is minimal concern about risk.
December Recap – Green
Green slopes are pejoratively called bunny slopes; these are generally gently sloping. Next you have blue, which are intermediate, followed by black diamonds, which can be single (advanced) or double black (expert):

If we look at the market’s current expectations for Fed policy, it is for six (6) cuts of 25 basis points each, making for a gradual downtrend that looks a lot like a bunny slope:
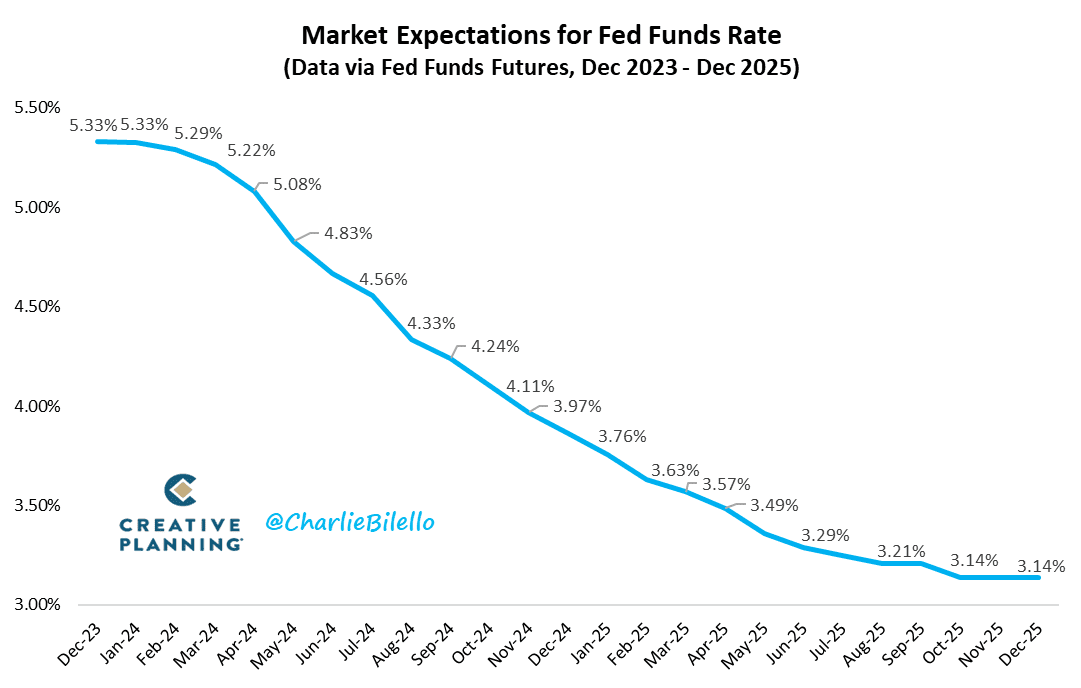
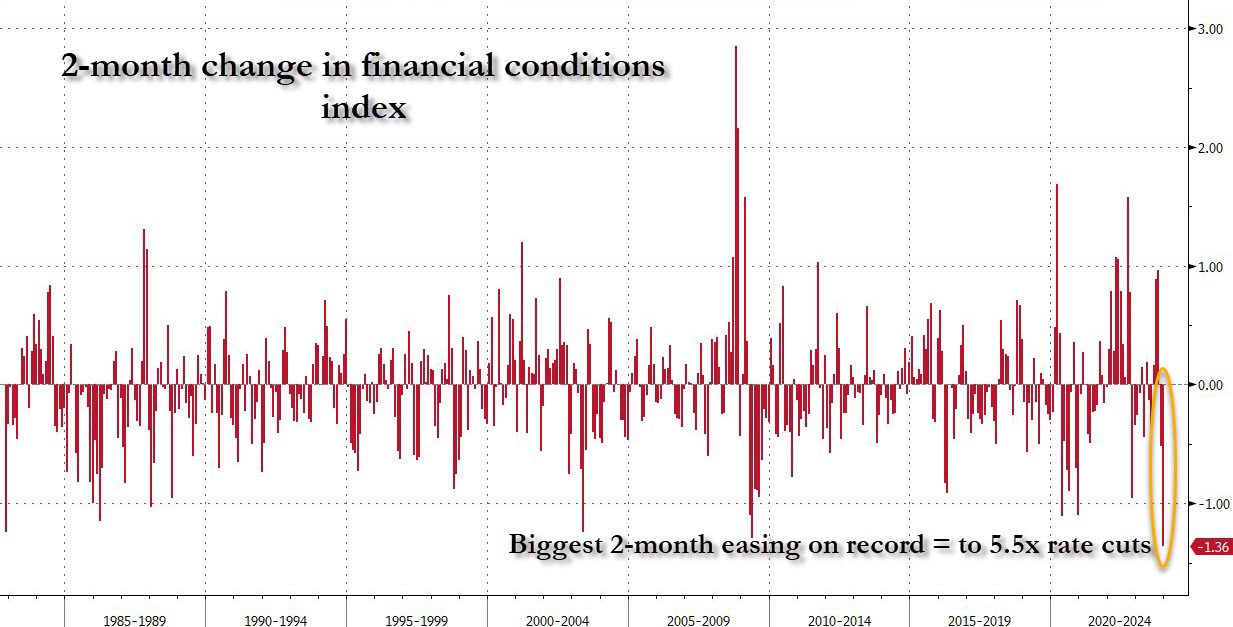
We will later address the historical precedent (or lack thereof) for such a pattern, but suffice it to say that, through December, this expectation added accelerant to the rally we saw in virtually all assets. In fact, we witnessed the most significant easing in financial conditions in recent history, i.e., a larger market response than during the global financial crisis or at the height of the Fed’s Covid response.
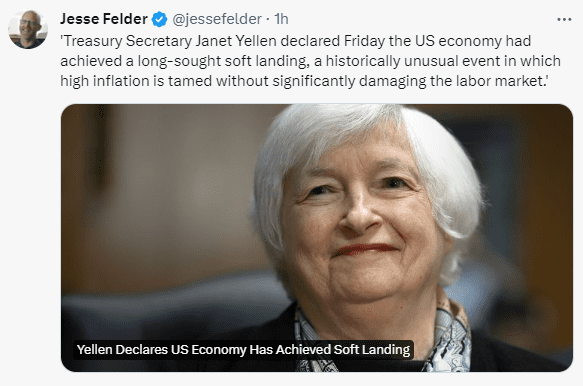
Why the exuberance? The growing chorus, including Treasury Secretary Yellen and fed Chair Powell, proclaiming we have achieved the mythical soft landing:
Index returns are certainly reflective of this sentiment as well:
| Index | 1-Month | 3-Month | 1-Year | 2-Year |
| S&P 500 INDEX | 4.53 | 11.68 | 26.26 | 3.37 |
| Invesco S&P 500 Equal Weight E | 6.82 | 11.81 | 13.70 | 0.48 |
| NASDAQ Composite Index | 5.62 | 13.84 | 44.70 | -2.35 |
| Russell 2000 Index | 12.23 | 14.02 | 16.88 | -7.03 |
| MSCI EAFE Index | 5.33 | 10.47 | 18.95 | 2.40 |
| MSCI Emerging Markets Index | 3.88 | 7.85 | 10.12 | -11.69 |
| Bloomberg US Treasury Total Re | 3.37 | 5.66 | 4.05 | -8.91 |
| Bloomberg US Agg Total Return | 3.83 | 6.82 | 5.53 | -8.20 |
| Invesco DB Commodity Index Tra | -3.32 | -7.39 | -6.22 | 11.91 |
Source: Bloomberg (as of most recent month end)
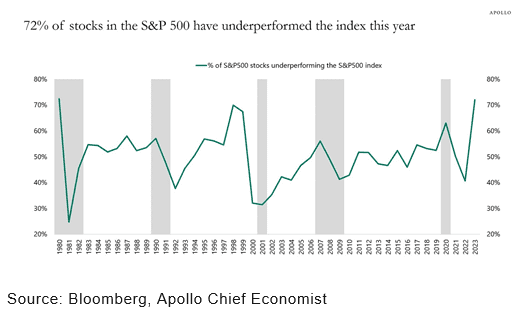
As an FYI, this was the best year for the NASDAQ since, you guessed it, 1999. Also, as we saw in 1999, it was a market in which most stocks (72% in fact) underperformed the index:
January Outlook – Blue
We track a like number of Key Factors, and although we note no material changes versus last month aside from the slight respite from higher interest rates, it is worth recapping (details in Part III):
| More Negative | Neutral | More Positive | |||
| Inflation | ≈ | ||||
| GDP Growth | ≈ | ||||
| Fed Policy | → | ||||
| Interest Rates | → | ||||
| Credit Spreads | ≈ | ||||
| Stock Multiples | ≈ | ||||
| Earnings Growth | ≈ | ||||
| Deteriorating | ← | ||||
| Stable | ≈ | ||||
| Improving | → | ||||
Conclusion – Black Diamond…or Double Black?
As a (formerly) competent skier, I tackled some black diamonds in my day. A time or two, I recall making the trek from the lift to the precipice of the run and thinking to myself, “this looks way more dangerous from up here.” I used my skiing fundamentals to try to navigate a path lower while taking on the least risk possible, i.e., avoiding the larger moguls, any random boulders, etc.
Though an obvious analogy, there are some steep market conditions that warrant our attention. Here are the top three:
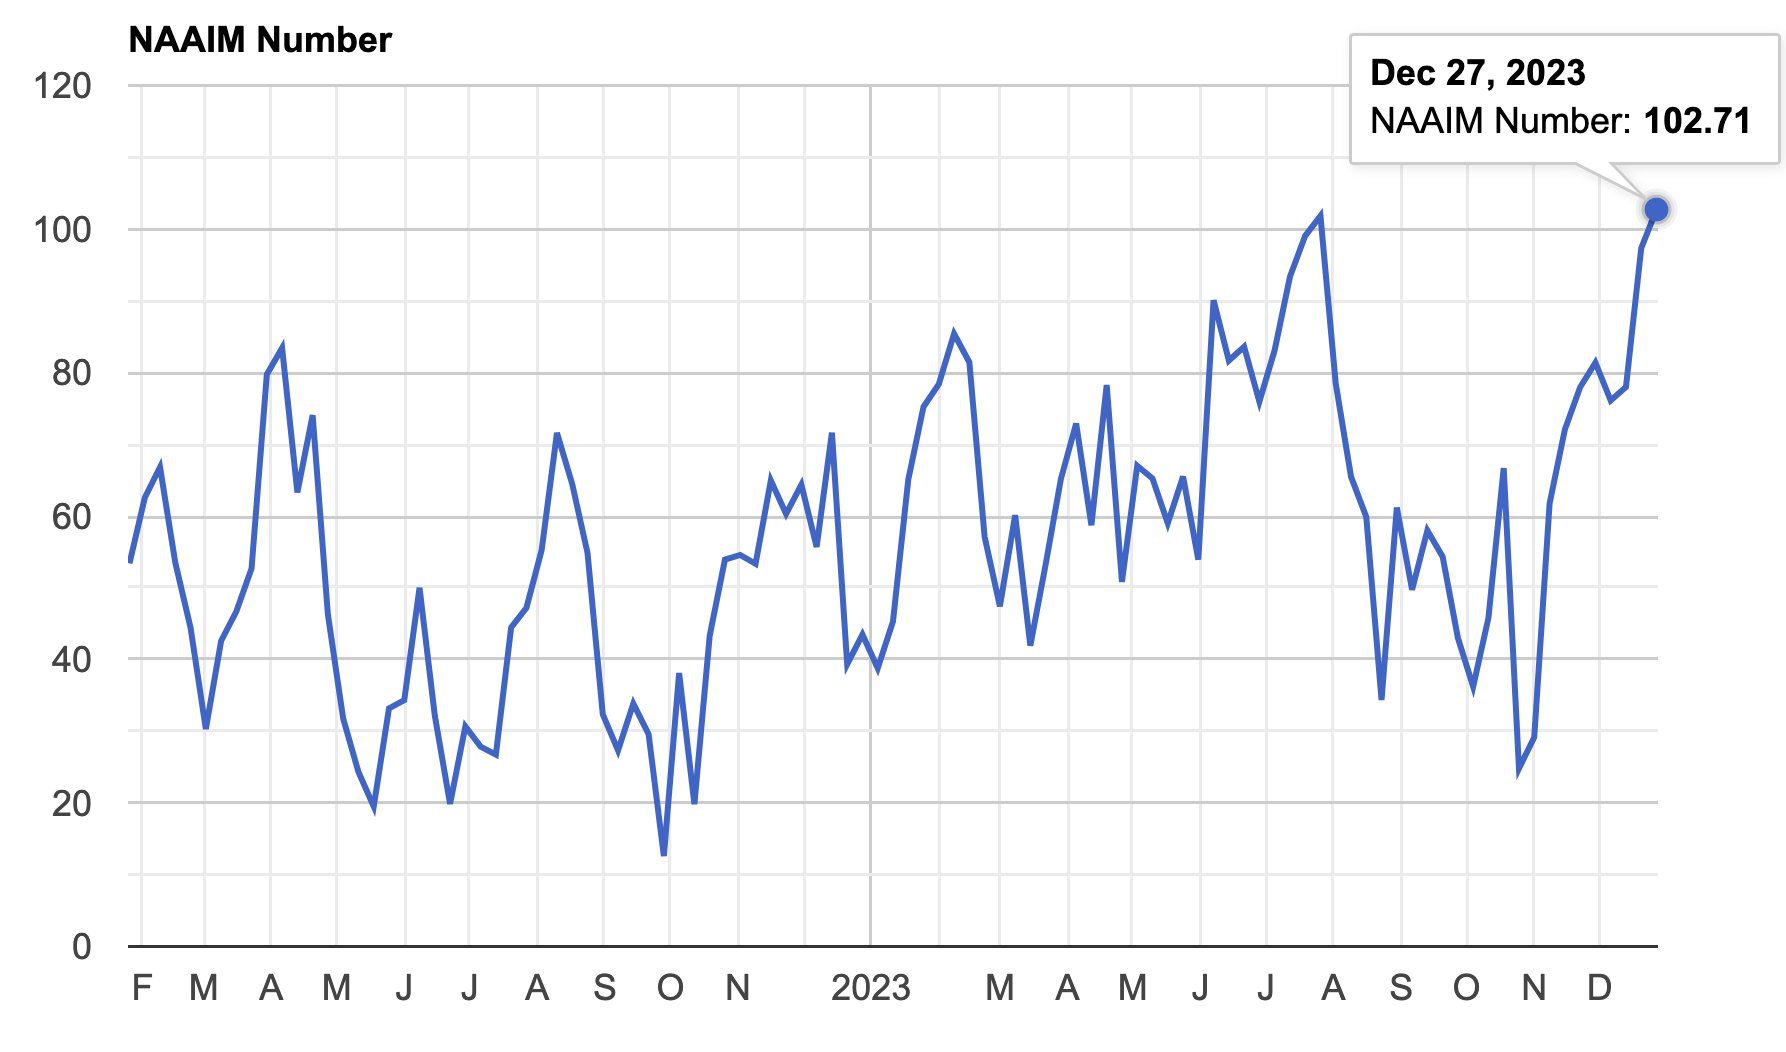
- The peak in investor sentiment to levels last seen in November 2021 is one:
- Earnings expectations are far too ambitious:
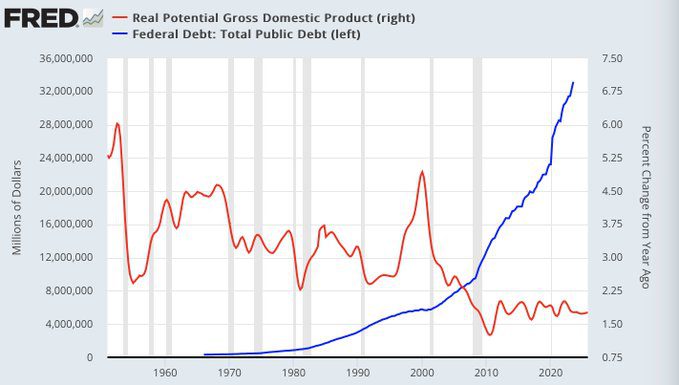
- Government debt. We can (somewhat) forgive the Fed for becoming dovish. As an astute industry friend noted recently, debt/GDP was 35% when Volcker raised rates in the 1980s to kill inflation; it is 135% now, so Powell cannot really be Volcker. The simple fact is that higher interest rates are becoming increasingly unaffordable, given the parabolic move higher in the U.S. debt:
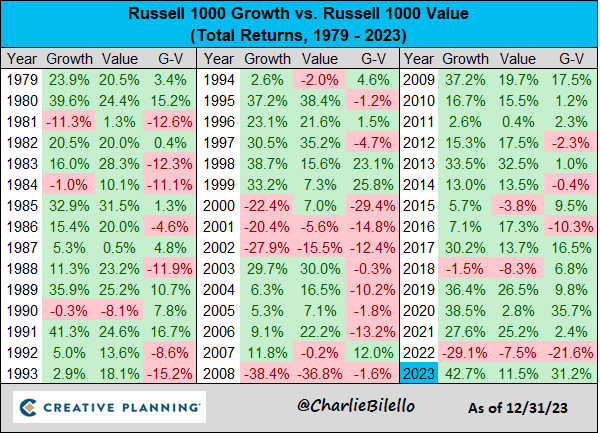
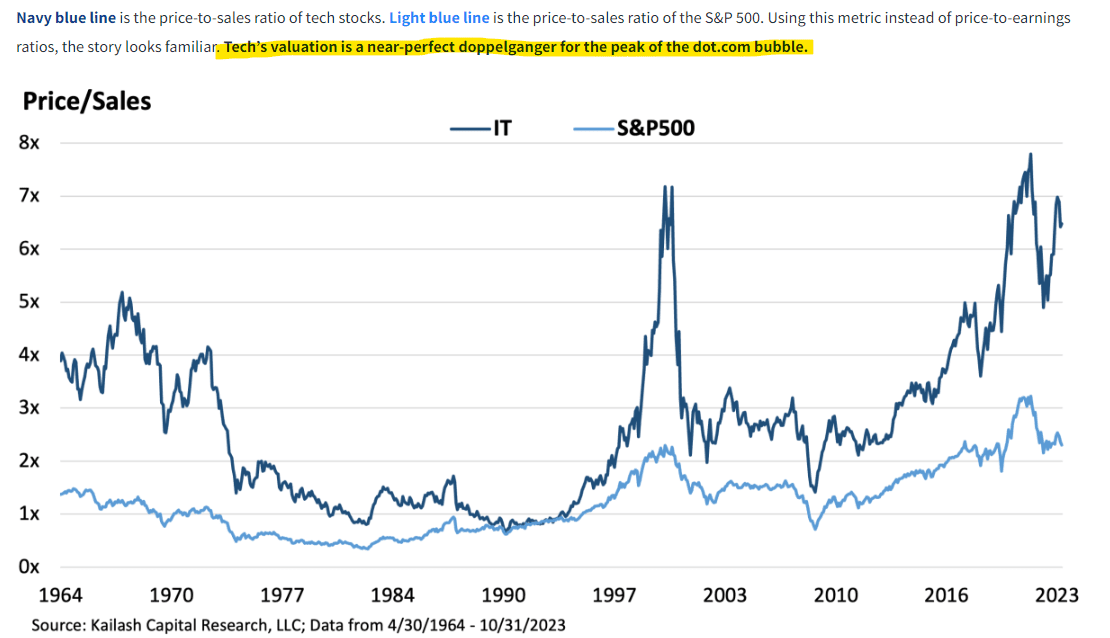
However, we do see opportunities to carve a safer path. For example, looking at value stocks, which lagged growth by the second widest margin on record, is one area. Small cap stocks lagged by near-record levels as well and represent another place to find values. Conversely, technology stocks are trading near historically high multiples:
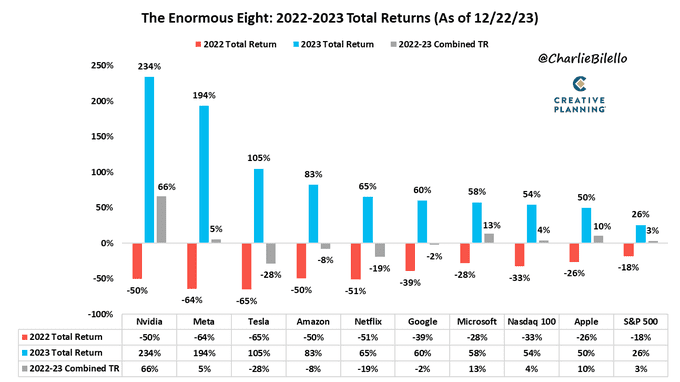
After a year like 2023, when everything went right, it is easy for investors to become overconfident. The fear from 2022 has been quickly replaced by the fear of missing out, though we would remind our investors that stacking these two years shows just how impactful large declines can be:
David Henning, one of our senior portfolio managers, recently introduced the “70-20-10 rule” to me, and I thought it represented a great framework for how we think about investing:
“The 70-20-10 Rule. Part 1 of the rule says that over 12 months, the return you get on a stock is 70% determined by what the U.S. stock market does, 20% is determined by how the industry group does, and 10% is based on how undervalued and successful the individual company is.
Part 2 of the rule says that over 10 years, 70% of how you do will be determined by the valuation and success of your company, 20% by how the industry does, and 10% by how the stock market does.
In other words, stock market movements and industry popularity drive one-year price movement. Company performance drives 10-year returns.”
Our job, ideally, is to find companies where the potential exists for clients to outperform over the long term, i.e., 10 years, and do it in such a way that we manage their journey so that drawdowns are more like a bunny hill than a black diamond.
In-depth analysis of Key Factors
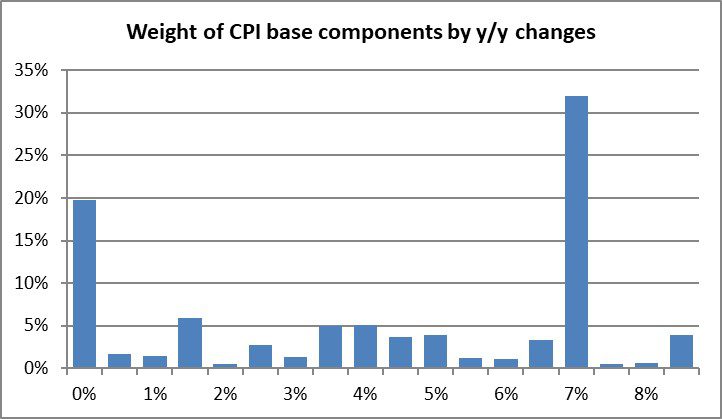
- Inflation – Negative and stable. The December CPI print was in-line with expectations at a headline rate of 3.1%. However, the distribution remains skewed toward the higher end, the easy work has been done with the decline from 9% to a little over 3%, and getting to the Fed’s stated 2% target would require deflation in housing:
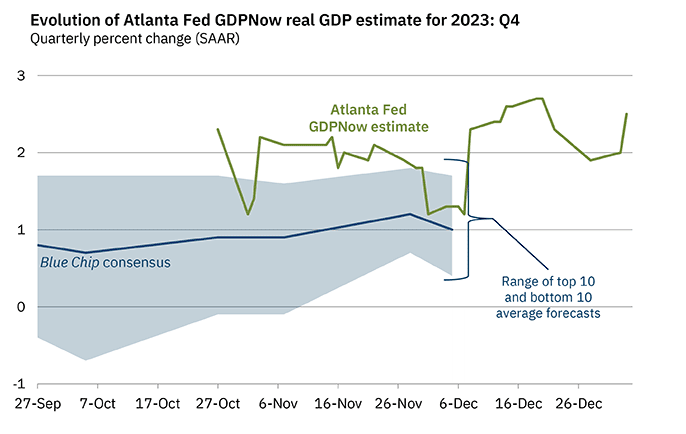
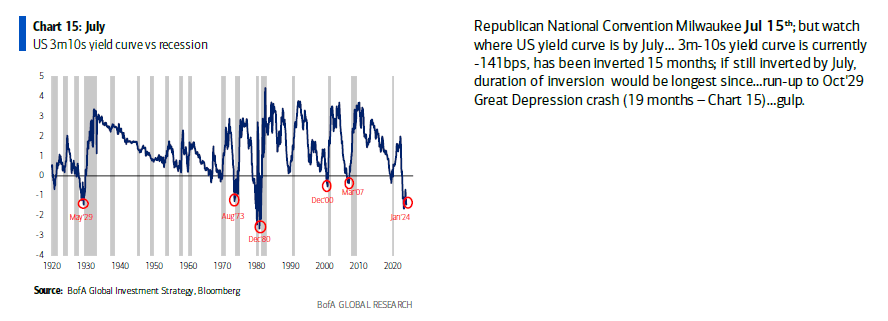
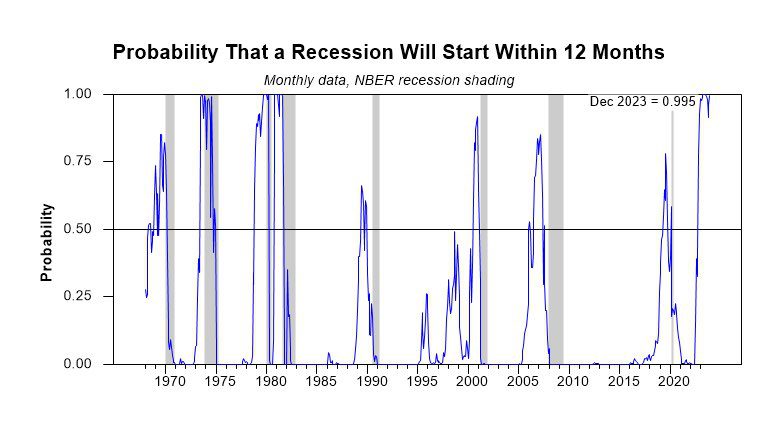
- GDP Growth – Neutral and stable. Employment data remains strong, and both nominal and real growth continue to surprise to the upside:
However, the yield curve tells a different story. The 3-month/10-year curve has been inverted for 15 months.
- Fed Policy – Negative but improving. Put us in the “we were wrong” camp here. We thought the Fed was serious about inflation, having learned from the Chair Burns mistakes in the 1970s. Powell’s December press conference made it clear that rate cuts in the near future are likely and that they are convinced of a soft landing; https://www.bloomberg.com/news/live-blog/2023-12-13/fomc-rate-decision-and-fed-chair-news-conference.
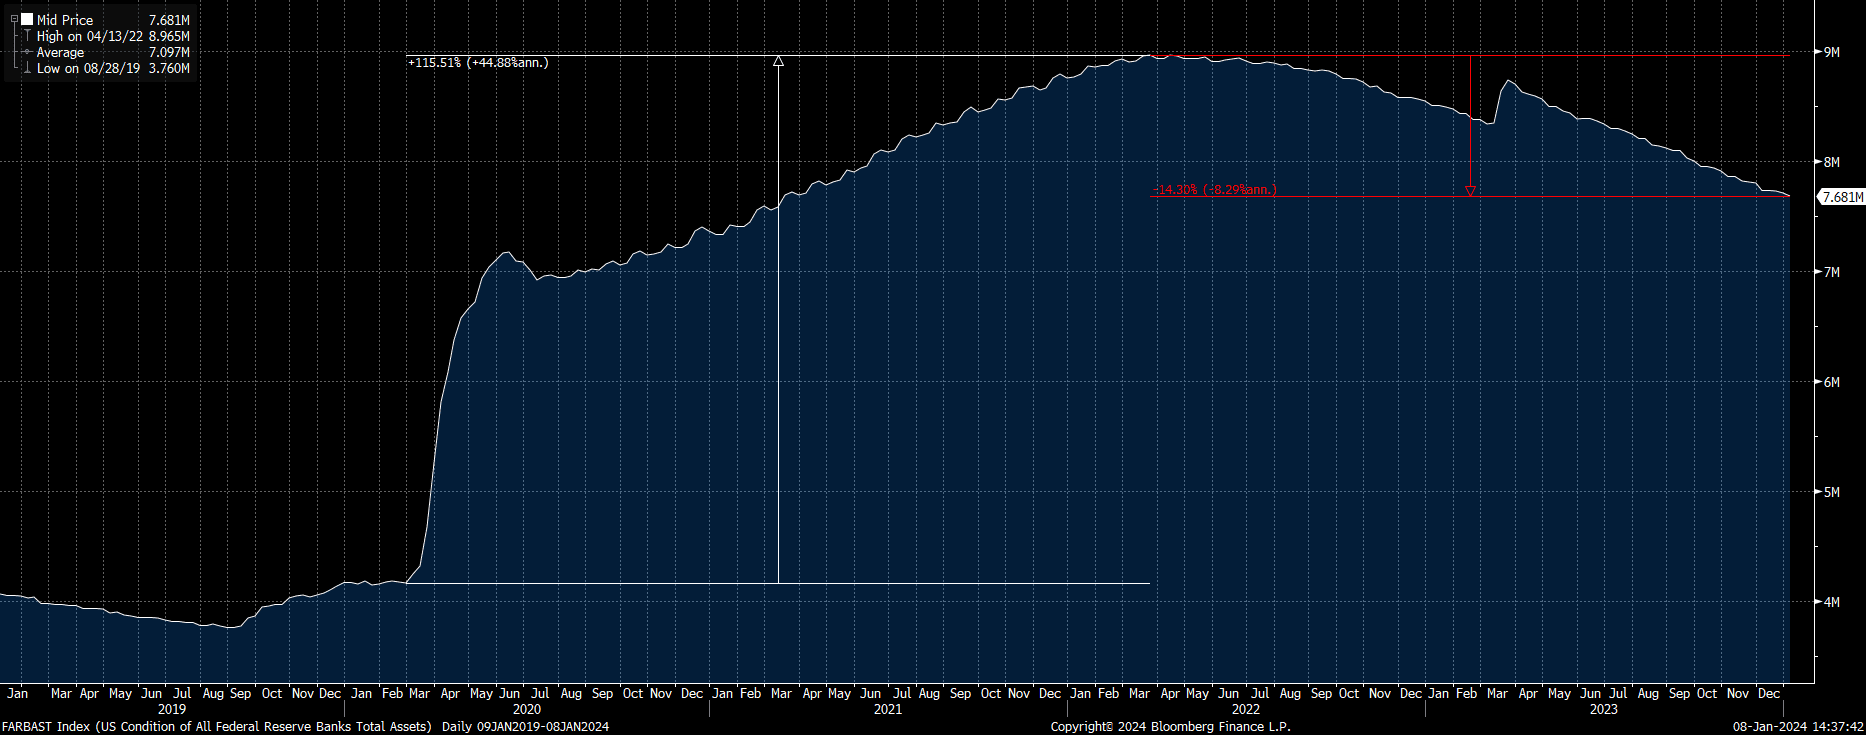
Additionally, there is discussion of an end to the Fed’s so-called quantitative tightening, which would also be a sign of Fed easing; https://www.ft.com/content/01322e44-91d8-48f3-bf8c-d590e330cc22?shareType=nongift. The actual magnitude of the tightening has been modest at best, with an over 100% increase followed by a 14% decrease.
- Interest rates – Negative but improving. The 10-year Treasury yield remains elevated versus its recent history but has dipped below 4%. Mortgage rates have fallen in concert:
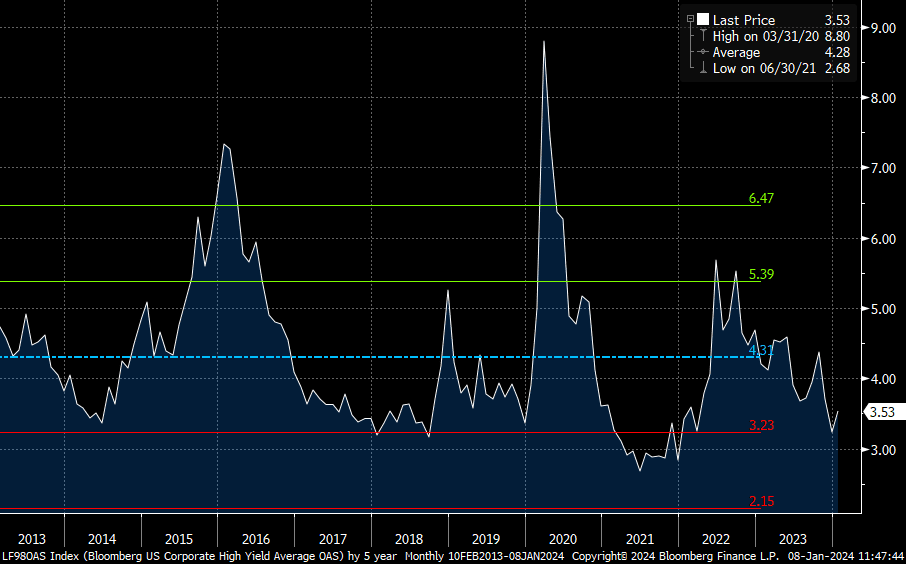
- Credit spreads – Negative and stable. A reminder we use this as a contrarian indicator. In other words, if we see spreads widening into the area above the green line, we may start to view risk/reward more favorably. High-yield spreads remain exactly in-line with their long-term average; investment grade spreads are similarly tight:
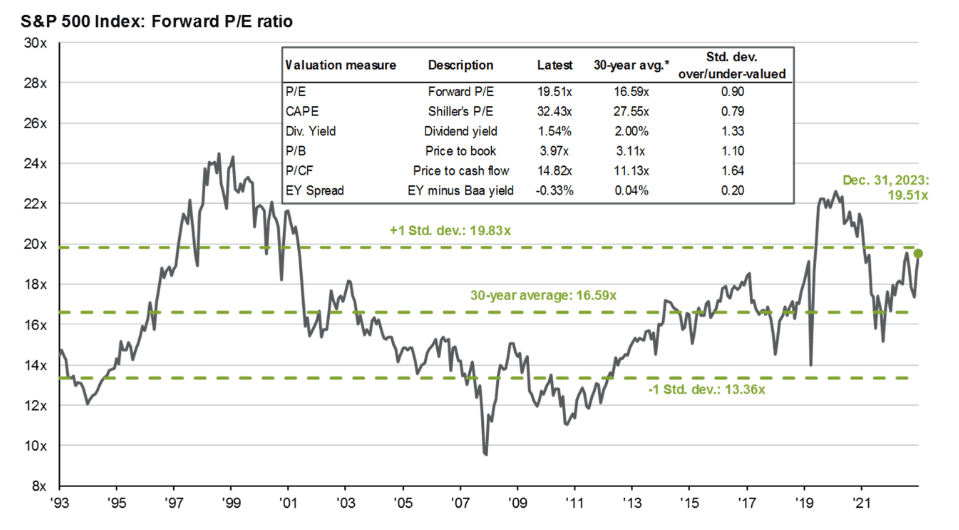
- Stock multiples – Negative but stable. Large cap stocks are not cheap at the index level. The top ten stocks are even more overvalued, and the S&P 500 Index is as concentrated as it has even been:
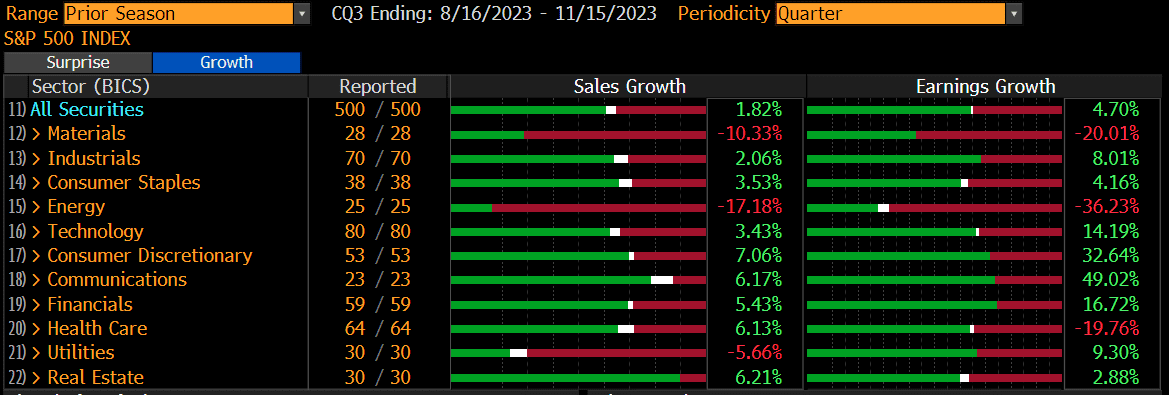
- Earnings growth – Negative but stable. Q3 earnings were okay. However, with rates higher than they were a year ago, we think expectations for 12-13% growth in 2024 are too ambitious.
Get Formidable News Direct to Your Inbox!
"*" indicates required fields
Check out our podcast Tea & Crumpets. Available on Apple Podcasts and Spotify.