
Market Commentary September, 2020

September Update
For those of you who read our monthly missives or listen to our podcast, you probably a) have too much free time, and b) understand that we have an affinity for wordplay. One of my favorites is the elusive triple entendre. I still remember being distracted for almost an entire soccer match because two of my teammates and I had discussed the concept before kickoff and spent the better part of 90 minutes trying to think of the best example possible.
Twelve years later, maybe history will be re-written. We give you dumbbells, which is an unprecedented (maybe?) quadruple entendre; we are dubbing this the Dumbbell Market. Why, you may ask?
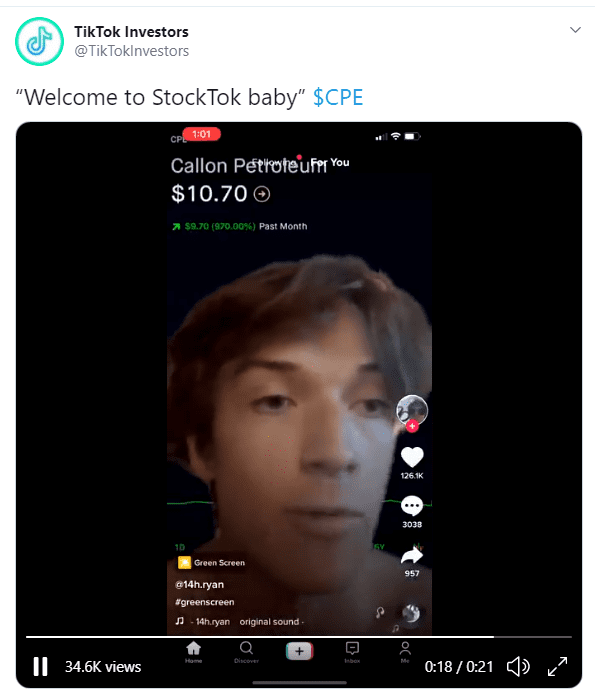
First, and most pejoratively, dumbbell is another word for someone who is maybe, to put it kindly, not the most informed. After earlier in the year having to explain why buying stocks of bankrupt companies is not a great idea, we are now explaining why you shouldn’t buy a stock up over 1,000% because it was rumored to get a dubious government loan and why stock splits do not actually change the underlying value of a company. We have seen some individuals buy stocks before a split for the “free shares” (this is not what happens) whereas others like our friend from StockTok (never thought I’d be typing that) touted his successful recommendation in Callon Petroleum, which went up over 900% in price, albeit due to a reverse split, i.e., his number of shares actually declined since each 10 shares pre-split were worth 1 share post-split.
There’s a common idea in poker circles—that if you’re playing at a table and you haven’t spotted the mark; the mark is you. We have to say, it has never been more tempting to build an investment strategy predicated on selling to greater fools—the marks. However, that is not what we do. Stock splits have been affecting stock prices in ways that defy economic sense, reminding us of this quote which, like many great quotes, is of dubious provenance, though sometimes misattributed to Marcus Aurelius or Tolstoy: “The object of life is not to be on the side of the majority, but to escape finding oneself in the ranks of the insane.” Right now, those in the ranks of the insane are raking in the dough.
Second, most of you know what a dumbbell looks like. If not, here you go (arguably, this is a dumbbell holding a dumbbell):

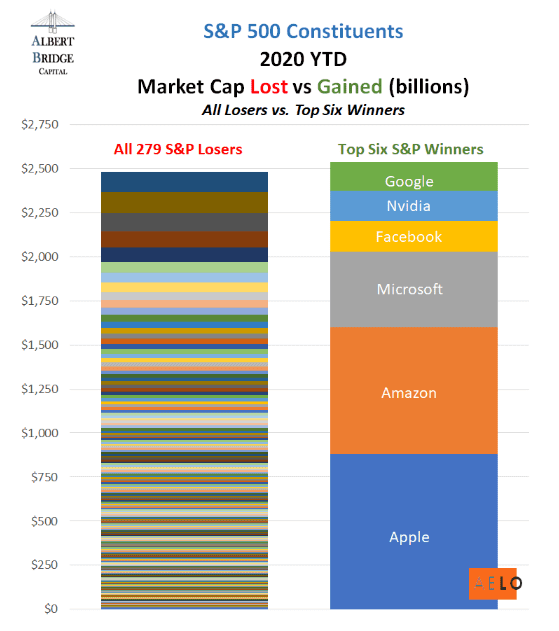
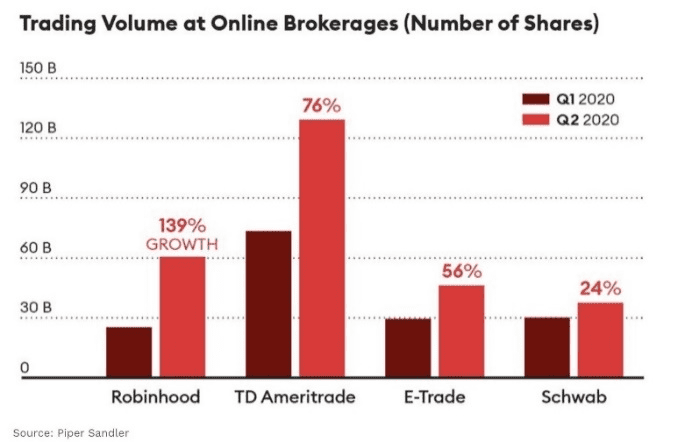
Investors often talk about barbell portfolios, where you weight the extremes and hold little in the middle. This is commonly seen in bond portfolios, where investors own short- and long-duration bonds, but none of medium duration. Let’s just say a dumbbell portfolio would be the same thing. That’s an accurate reflection of what has been working in the market: the biggest names that comprise huge percentages of market indices (Graph One), a combination of megacap tech and the smallest names that the aforementioned dumbbells have been chasing (Graph Two); these are up almost 40% year-to-date. Also, if you think day trading is just a Robinhood thing, think again (Graph Three).
Graph One
Graph Two
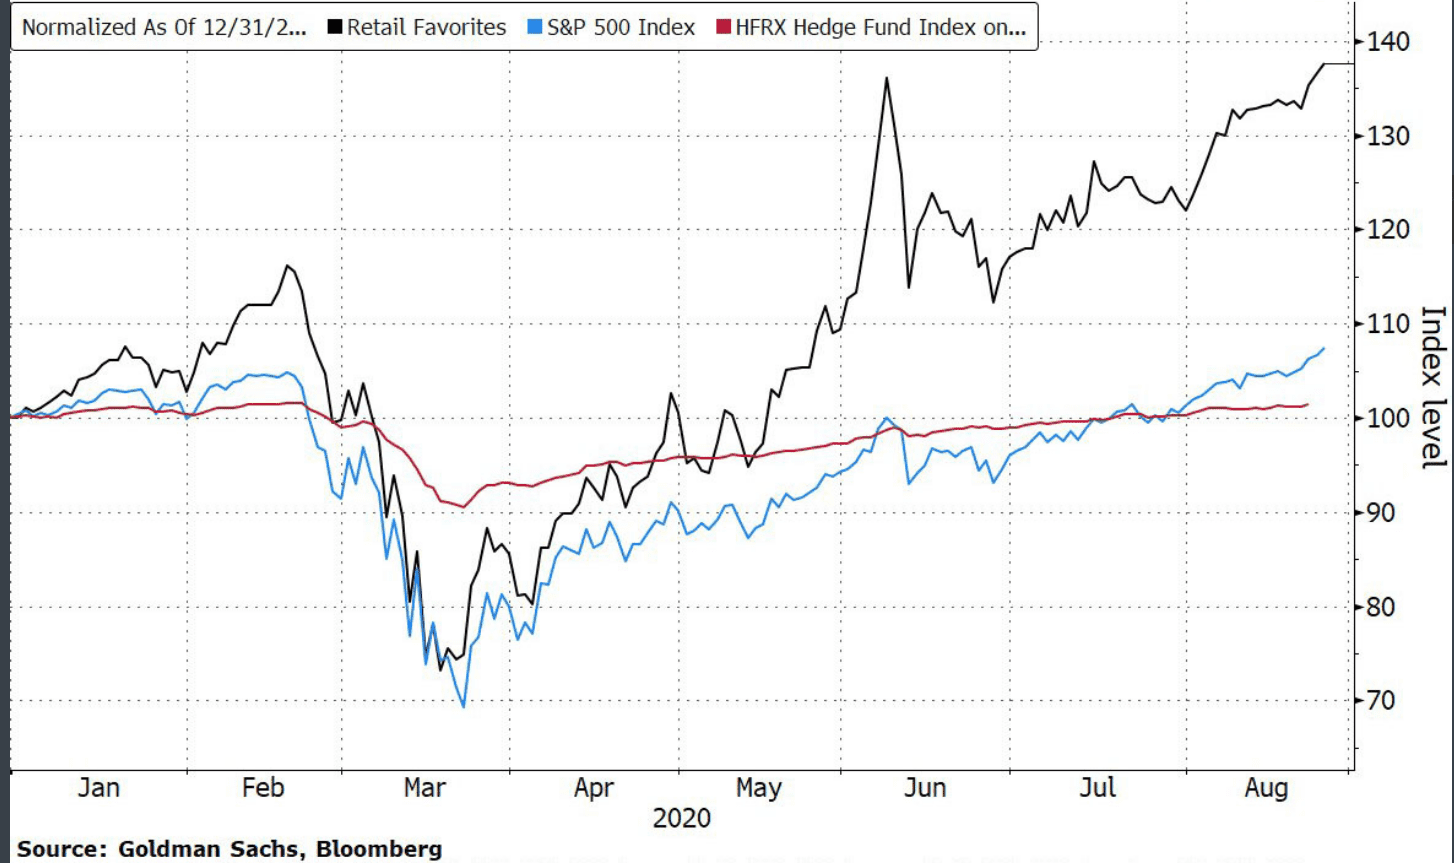
Graph Three
Third, from an etymological perspective, a dumbbell is just, a bell that makes no noise. There’s an old market adage, “they don’t ring a bell at the top.” This is certainly true. In the pantheon of investor types, there are permabulls (they never hear a bell) and permabears (they have the investment equivalent of tinnitus); between the two are a small group of people like us who are pragmatic, not dogmatic, and look to keep clients invested while managing risk prudently. Right now, the risk of owning an exclusively index-oriented portfolio, whether in fixed income or equity, is quite high.
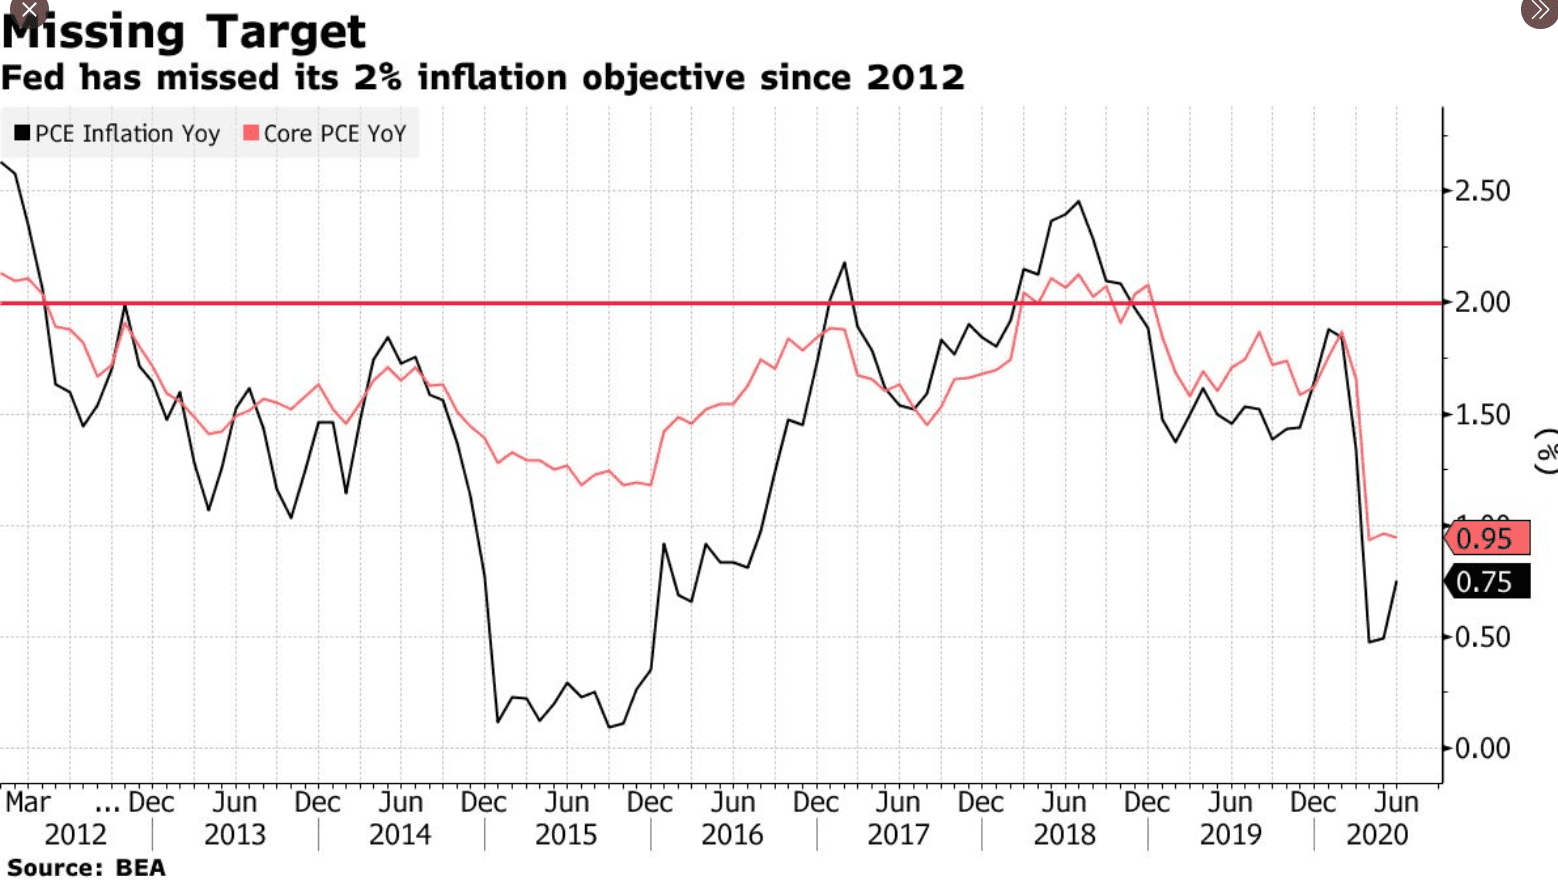
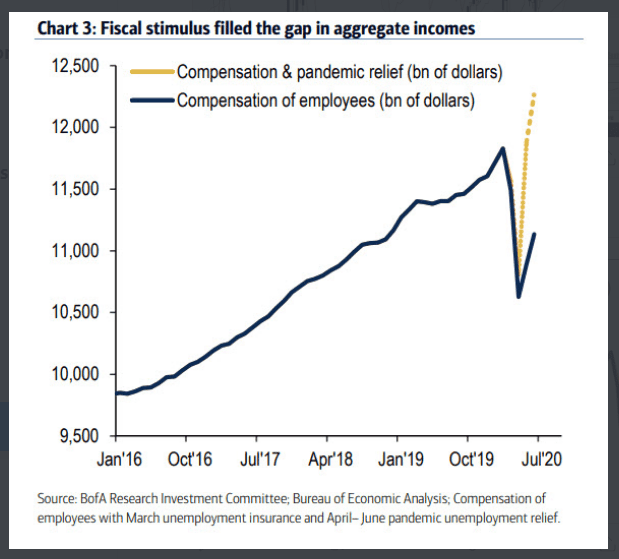
Fixed income is more mathematical. The ten-year U.S. treasury remains near historic lows, albeit it climbed off the mat this week as the Fed made it clear it would attempt to generate above-trend inflation. Admittedly, it has failed in all prior efforts at generating inflation (Graph Four), as have the Bank of Japan and European Central Bank, but maybe this time it works, given the fiscal stimulus in the we have already seen (Graph Five), not to mention the prospect of more to come. With corporate credit spreads also near lows, generating returns in fixed income appears challenging. We will tackle the prospects for inflation in an upcoming piece on just this topic, as it will be a key determinant in terms of portfolio positioning prospectively.
Graph Four
Graph Five
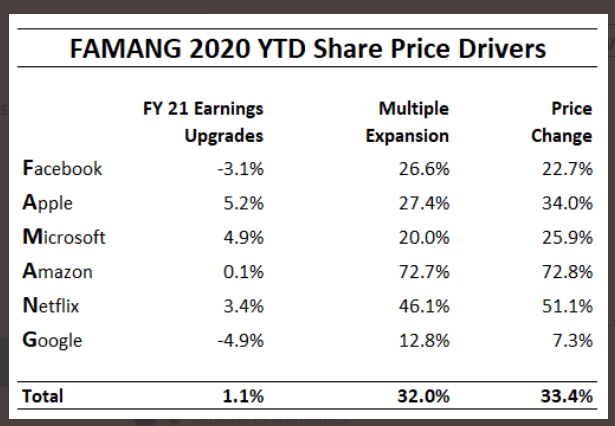
Equities are trickier. Momentum is good, albeit narrow (Graph Six), sentiment, i.e., greed, has returned to the “extreme” level, and volatility measures are near low (though have started to move a bit higher of late). Let’s remember our sources of return: dividends, growth, and multiple expansion. This year has been driven almost exclusively by multiple expansion of the largest names (Table One), which is simply unsustainable.
Graph Six
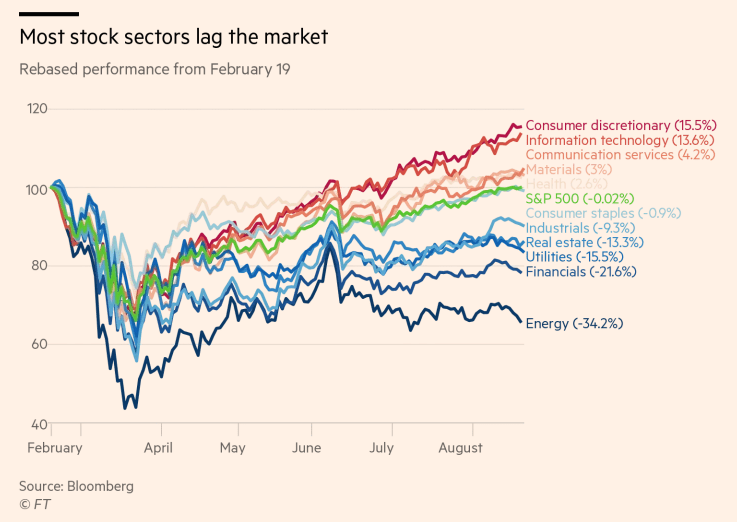
Table One
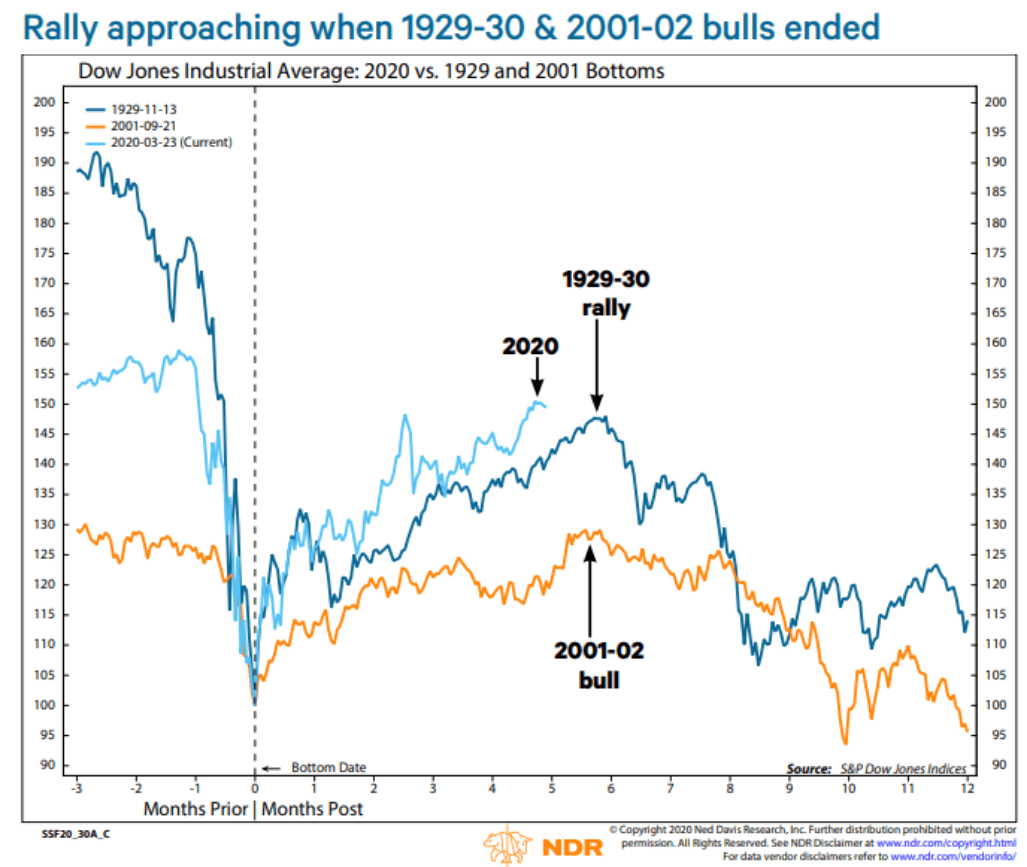
The question is, are we in the eye of the hurricane or has the storm passed. For the former, here’s what it looks like (Graph Seven). Though hard to remember, we rallied after the tech wreck, only to fall again. If the storm has passed, i.e., it’s 2009 again, we have more room to run.
Graph Seven
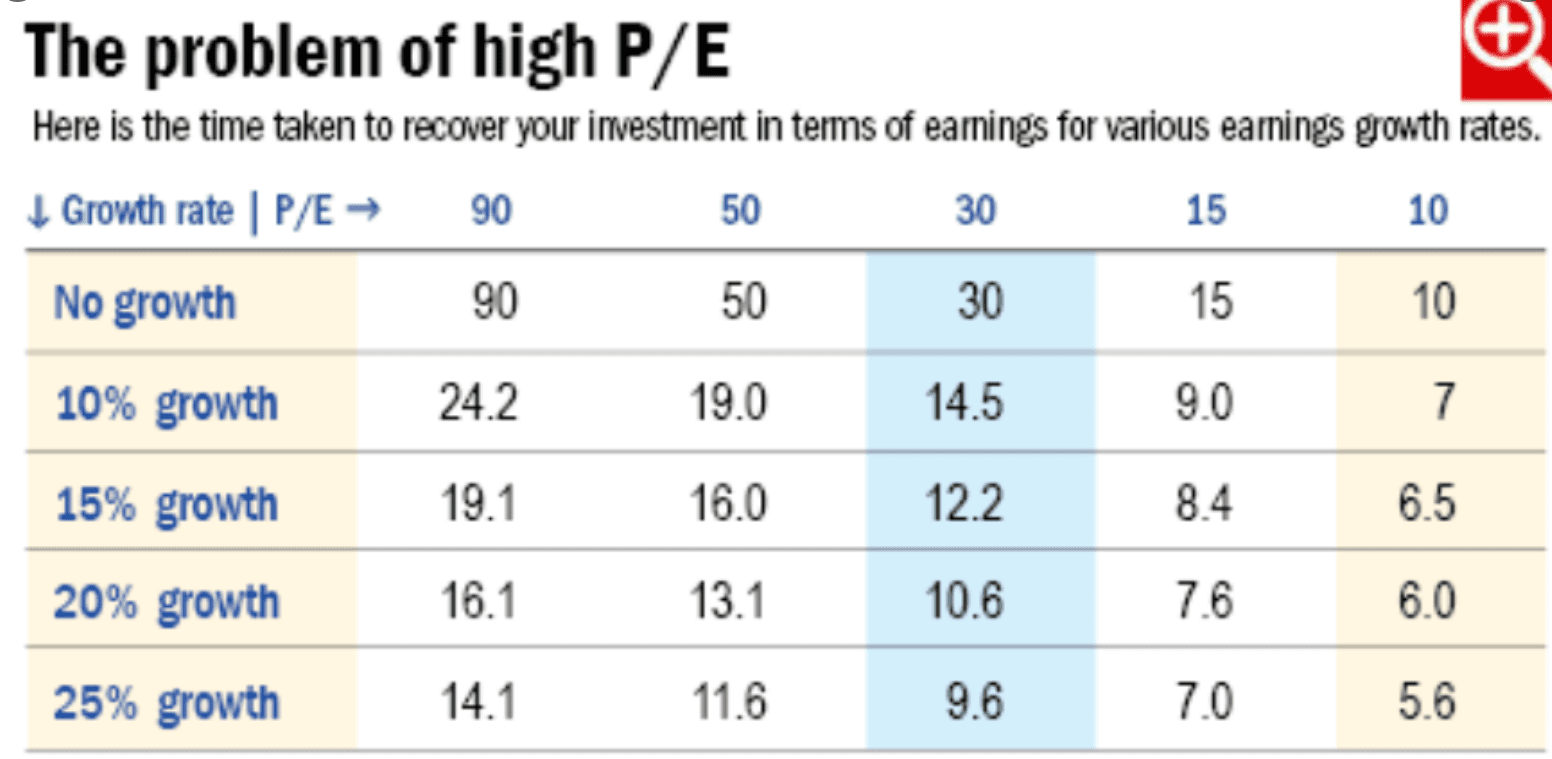
So, what’s the challenge with valuations at these levels? Again, it is math (Table Two). The higher the price we pay for an investment, the longer its payback period, to use an underutilized investment concept. The math is even more difficult for megacap names, as it is more difficult for a larger company to grow as quickly. As your base grows, i.e., your denominator, it becomes more difficult to maintain your historical rate of growth.
Table Two
This valuation shows up in the multiple we pay for a stock. As discussed previously, almost the entirety of year-to-date returns have been the result of multiple expansion. This would be part of the “price” return in the following graph, though that figure is comprised of multiple expansion and growth, with the latter typically more impactful. It is worth noting price has been the primary source of returns since the 1980s, when we entered a period of secular deflation/lower interest rates. The 1940s through 1970s reflected the opposite. Again, more on this in a future piece.
Graph Eight
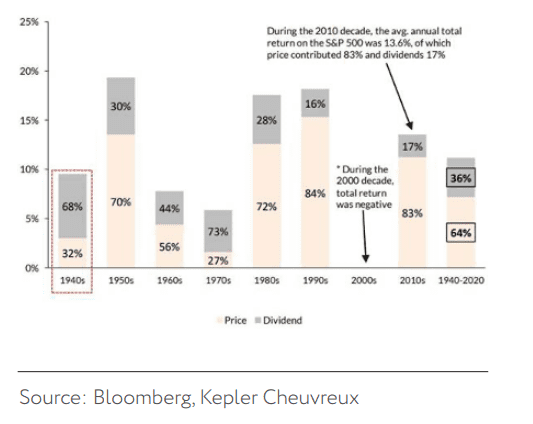
Source: Driehaus Capital Management
Well, we promised you a fourth piece of the entendre, so here it is. To dumbbell is a verb associated with buying two short-distance train tickets (the beginning and end legs) to avoid paying the full fare. Seems like this applies to investing as well. No one wants to pay the full fare, i.e., be invested through the ups and the downs. Everyone is looking for short cuts, be it frontrunning stock splits or blindly buying an index.
As with most things, this can work for in the short-term, but eventually the conductor comes to check your ticket at a most inopportune time. Nobody rides for free, especially dumbbells trying to dumbbell a dumbbell portfolio waiting to hear a dumbbell before they sell.
READY TO TALK?