

November 2023: Gallia est omnis divisa in partes tres
Part I – General audience
November Update: Swift Justice
Having only recently moved back to Cincinnati, I was a little unprepared for the autumnal gloom that can overwhelm the beauty of the foliage. This became apparent on a jaunt to Pittsburgh for our daughter’s soccer team where, unfortunately, the soundtrack was (and I am only being somewhat hyperbolic here) driver of GDP growth, inspirer of Halloween décor, and destroyer (or would-be savior) of American football, Taylor Swift. We will celebrate her entire catalog (as well as another, older Swift).
Key Takeaways
- Anti-heroes abound, with October’s decline putting the S&P at three monthly losses in a row.
- From its July high, the S&P fell a little over 10% before bouncing to start November.
- Q3 earnings have exceeded expectations but were already reflected in stock prices.
- A sharp increase in bond yields has hurt both stocks and bonds.
- For the Magnificent Seven, is it going to be forever, or is it going to go down in flames?
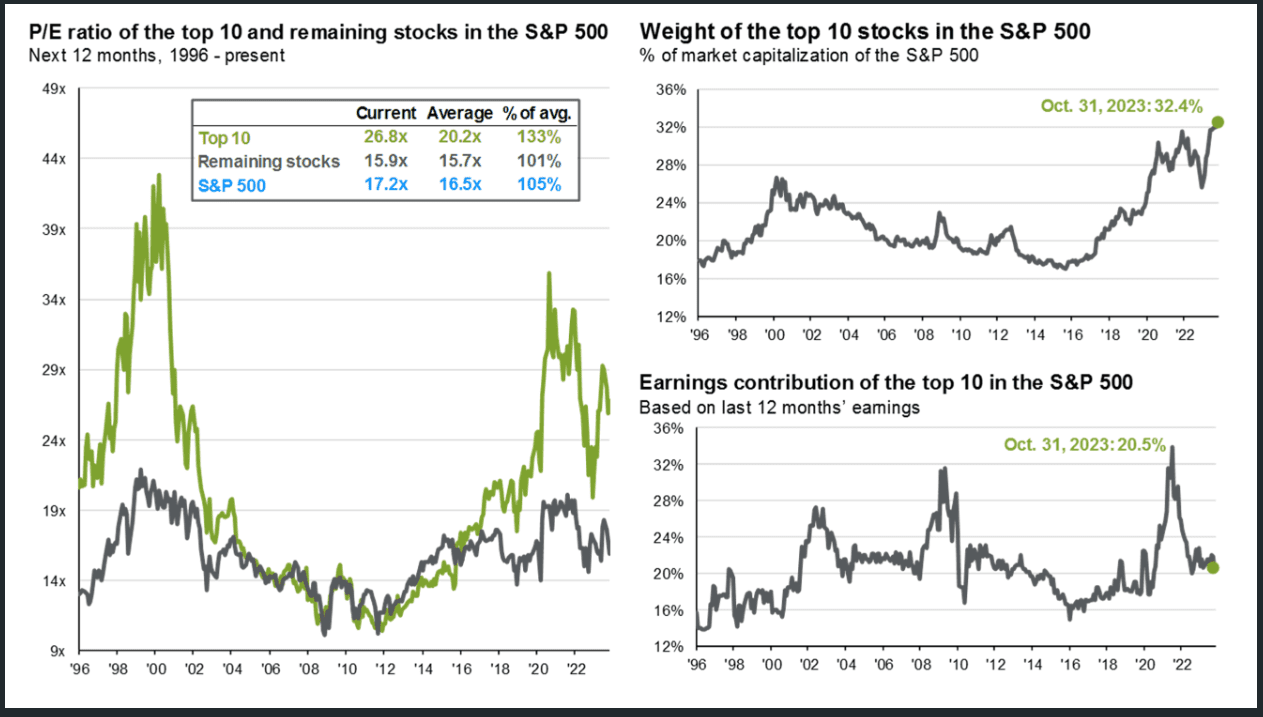
- Seven (7) stocks represent over 32% of the S&P 500 index, an all-time high.
- These seven stocks are 40% more expensive than the rest of the index, and…
- …are responsible for the entire gain in the S&P 500 this year; the average stock is down 3%.
- A modest proposal for how we are positioning for the rest of 2023 and beyond.
- Avoid the index; “investors” putting over 30% of their assets in stocks that are up 78% this year, effectively in a single sector, and more expensive than ever are failing in terms of risk management, yet that is exactly what indexers are doing.
- Balance both risk and reward in light of your investment objectives, not what a group of speculators, indexers, or your friends are doing.
- Look for securities where expectations are low and income opportunities are high.
On an unrelated note, I was shocked, shocked, to learn this week that some clients don’t read our entire newsletter. For those who prefer not to read further, before you close the email, please know these three things.
- The Magnificent Seven stocks fell 45% in 2022 while the average stock was down around 12%.
- Since the market high of December 2021, neither stocks nor bonds have a positive return.
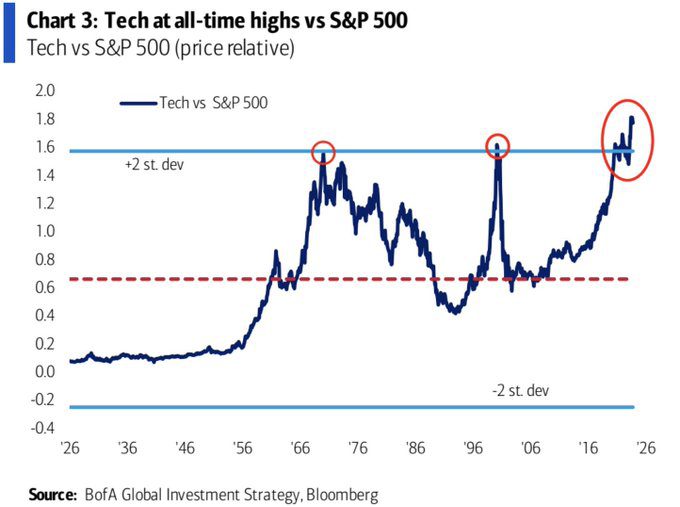
- Technology stocks are at an all-time high versus the rest of the S&P 500, and even more overpriced than the prior peaks (Nifty Fifty and Tech Bubbles). Caveat emptor.
| Index | 2022 | YTD 2023 | Combined |
| S&P 500 INDEX | -18.13 | 10.68 | -9.38 |
| Invesco S&P 500 Equal Weight | -11.62 | -2.51 | -13.85 |
| Bloomberg Magnificent 7 Total | -45.32 | 78.42 | -2.43 |
| Russell 2000 Index | -20.46 | -4.48 | -24.02 |
| Bloomberg US Agg Bond | -13.01 | -2.77 | -15.42 |
Part II
October Recap – Anti-Hero
“It’s me, hi, I’m the problem, it’s me, At tea time, everybody agrees, I’ll stare directly at the sun but never in the mirror, It must be exhausting always rooting for the anti-hero.”
The list of anti-heroes from a market perspective is long and growing at this point. First is geopolitics with Ukraine still embroiled, Gaza threatening to bubble over, and China/Taiwan on the back burner but getting hotter. Here is what investing legend Stan Druckenmiller had to say at a recent conference: “’78, ’79 was bad. But I mean, for the first time, it’s a very low probability, but you gotta put the potential outcome of World War on the table. Not exactly an environment that excites me about paying 20 to 30%, above the multiple for equity prices.” We are investment managers, not experts in foreign policy (neither is Druckenmiller) but let’s just say we agree with his assessment that paying a premium for the index, i.e., the S&P 500, in this environment, does not excite us, either.
Economically, one anti-hero is Jerome Powell, who clearly has never looked in the mirror as it relates to taking responsibility for fueling the very inflation he is now struggling to tame. However, as we see on the following graph, at least he did reduce the Fed’s holdings of government debt (the orange line, i.e., the Fed’s System Open Market Account, or SOMA). That SOMA is also the drug the population was given in Brave, New World to eliminate anxiety is a little on the nose.
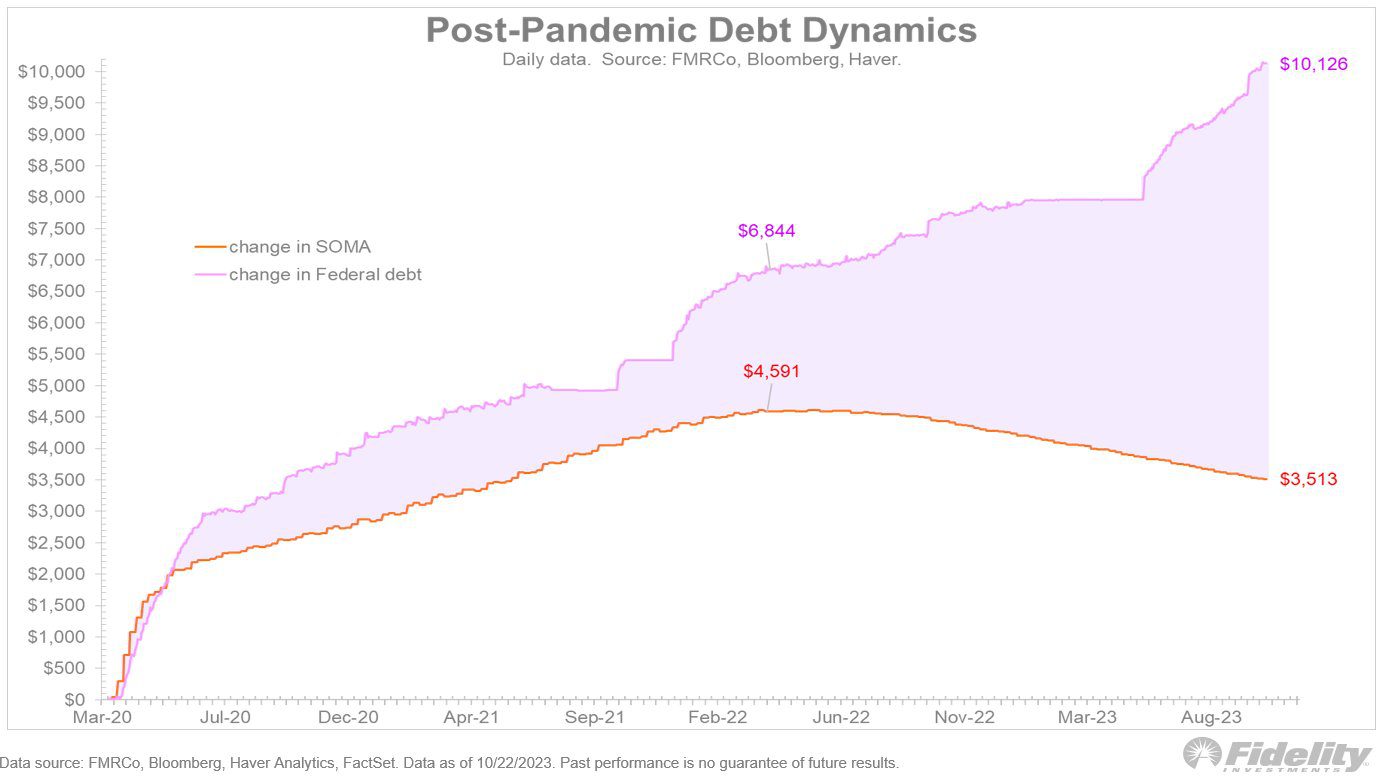
Going the opposite direction is government debt, where the anti-heroes in the political class have taken it on themselves to spend as much as possible as quickly, first in response to Covid (valid) and then to get re-elected (less valid) . The growing chasm between the purple and orange lines is the reason the bond vigilantes, about whom we wrote extensively last month and, accordingly, will not rehash, have driven interest rates significantly higher. To put it in terms a Taylor Swift fan might understand from her song Vigilante, uh, Stuff, “I don’t start [it] but I can tell you how it ends; Don’t get sad, get even.”
Whereas at least commodities were positive in September, every major asset class was negative in October:
| Index | 2022 | YTD 2023 | Combined |
| S&P 500 INDEX | -18.13 | 10.68 | -9.38 |
| Invesco S&P 500 Equal Weight | -11.62 | -2.51 | -13.85 |
| Bloomberg Magnificent 7 Total | -45.32 | 78.42 | -2.43 |
| Russell 2000 Index | -20.46 | -4.48 | -24.02 |
| Bloomberg US Agg Bond | -13.01 | -2.77 | -15.42 |
Source: Bloomberg (as of most recent month end)
November Outlook – Blank Space
“So it’s gonna be forever, Or it’s gonna go down in flames, You can tell me when it’s over, mm, If the high was worth the pain.”
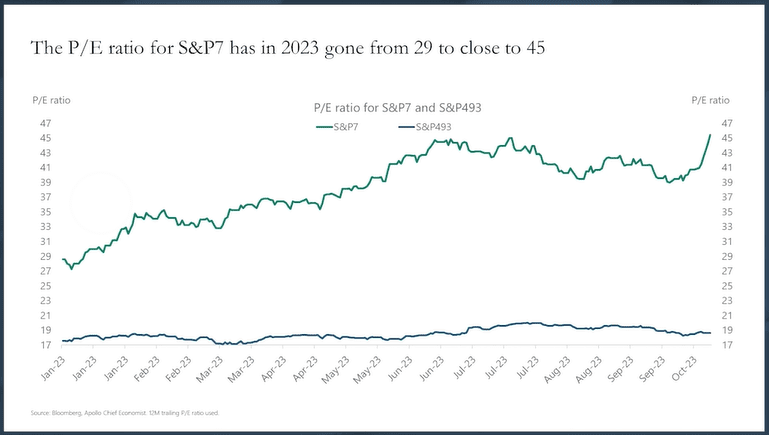
This is where we are on the Magnificent Seven. It seems like this either goes on forever or goes down in flames. As we wrote last month, the disconnect between the ten-year Treasury yield and these stocks would indicate either the valuation for these stocks or the yield on the 10-year needs to go down in flames in a rational world. While earnings have been strong for these names, a 50% increase in multiple (from 29 to 45) has done the heavy lifting and is, in our opinion, too optimistic:
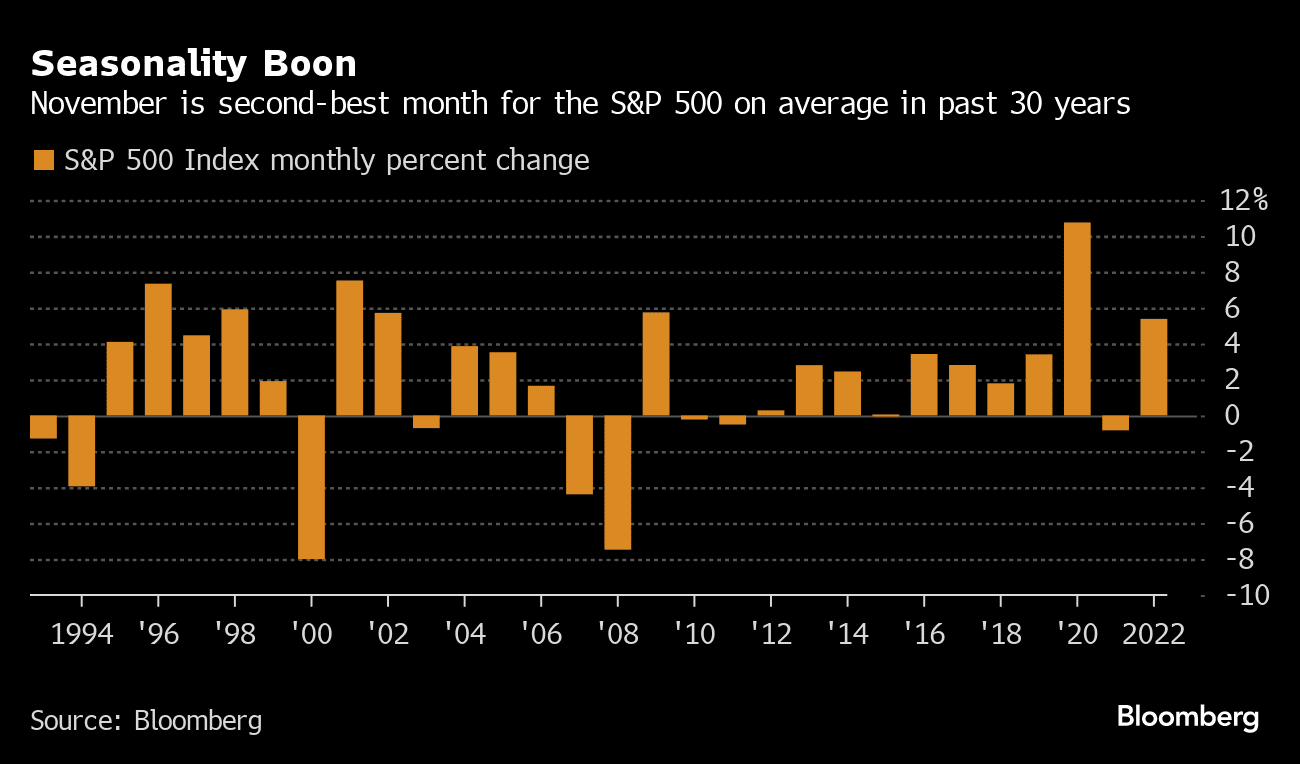
However, since this is technically the November Outlook portion of the update, we would be remiss if we did not note November as the second strongest month on average, and the month that typically kicks off the strongest six-month period for equities. As compliance always reminds us, past performance is not indicative of future results, and although the first few days of November have seen a sharp rally (highly shorted junk stocks gaining over 10% has been a huge help), as we will see from the factors we evaluate, the set-up remains challenging:
We track a like number of key factors, and although we note only one material change versus last month, it is worth recapping in our table below. (For those who want to understand the finer details, click HERE ç [ADD LINK HERE?]. Link to last section or to another page?
| More Negative | Neutral | More Positive | |||
| Inflation | ≈ | ||||
| GDP Growth | → | ||||
| Fed Policy | ≈ | ||||
| Interest Rates | ≈ | ||||
| Credit Spreads | ≈ | ||||
| Stock Multiples | ≈ | ||||
| Earnings Growth | ≈ | ||||
| Deteriorating | ← | ||||
| Stable | ≈ | ||||
| Improving | → | ||||
Conclusion – A Modest Proposal
“Did you have to do this? I was thinking that you could be trusted. Did you have to ruin what was shiny, now it’s all rusted?”
For reasons beyond logical comprehension, indie-rock singer/songwriter Ryan Adams did a cover of Taylor Swift’s album 1989, which included the above-referenced Bad Blood. As with most cover songs/albums, it left a lot to be desired, to put it mildly.
The point is that recapturing magic, like when artists cover a song, is difficult. We think that is the case with the index and the Magnificent Seven here as well. Is what was shiny going to become rusted? Can we return to all-time highs led by the same handful of names? Perhaps. Is it likely? No.
Based on what we see in terms of earnings expectations for the index (+12% in both 2024 and 2025), and even higher for the Magnificent Seven, we think some of these estimates may need a really deep cut, though there is a modicum of irony in that one of our interns (great work, Amol) quickly pulled these estimates using Chat GPT.
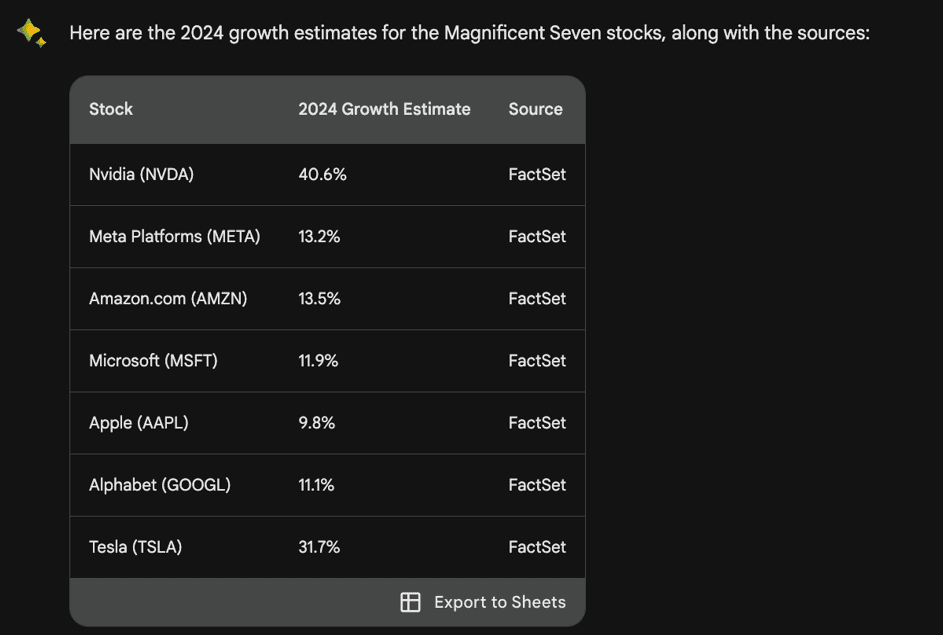
Can the biggest companies in the world all growth at more than 10%? Apple just closed the books on its 2023 fiscal year. Versus 2022, its revenue declined from $394B to $383B. Its earnings per share were basically flat ($6.11 in 2022 and $6.12 in 2023, thanks to stock buybacks, in large part). Will 2024 be better?
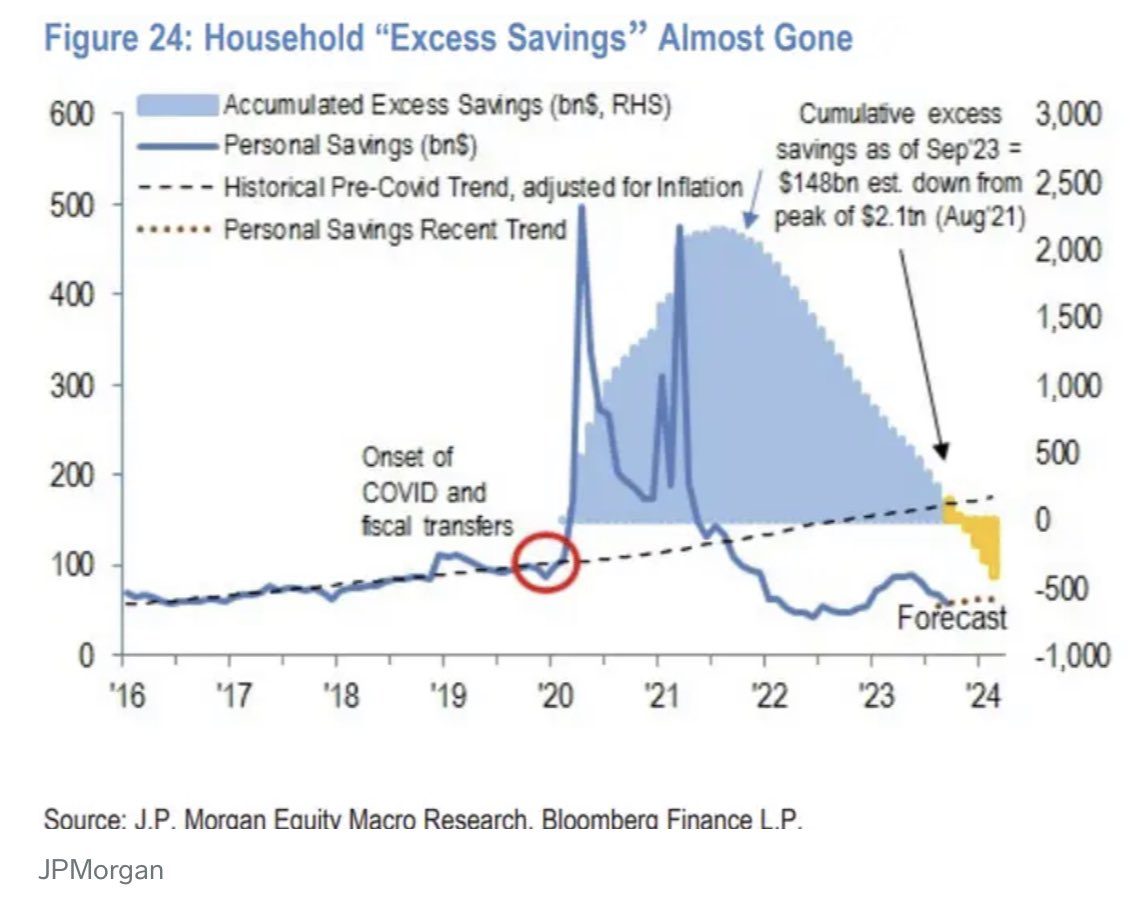
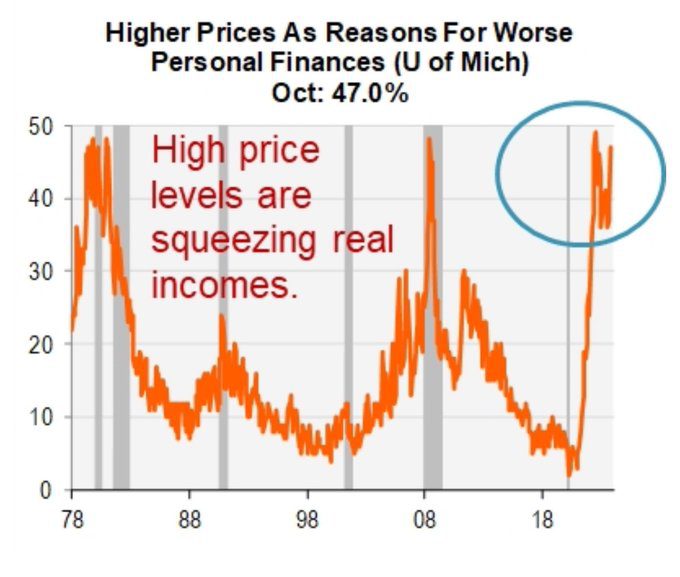
We think that is where the challenge lies. The reason we see achieving outsized growth in 2024 as unlikely is that the headwinds faced by the markets are amplifying. Although stock ownership resides predominantly in the upper echelons of the income demographic, the pain that is starting to be felt as surplus savings are exhausted with inflation at painful levels has economic (and stock market) consequences.
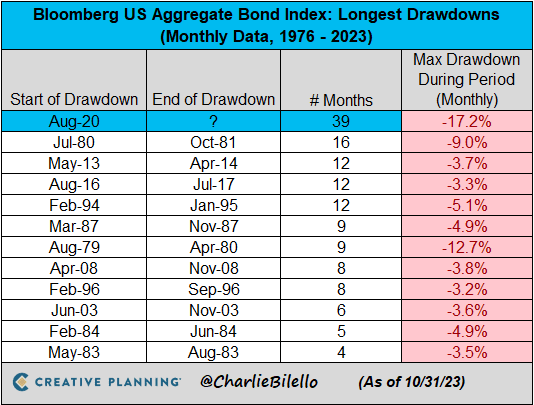
Investors thought bonds could be trusted. However, with the Bloomberg Aggregate Bond Index in its longest (and largest) decline since data started being collected in the 1970s, there is certainly some bad blood for bond owners.
The question we ask ourselves is this: Can Jay Powell be trusted? Right now, the market is betting he can, indeed, be trusted to engineer a soft landing for the economy. Historically, rapid rises in interest rates have seen short-ish plateaus (did you have to do this) to rapid cuts (now we got problems). In other words, probably not.
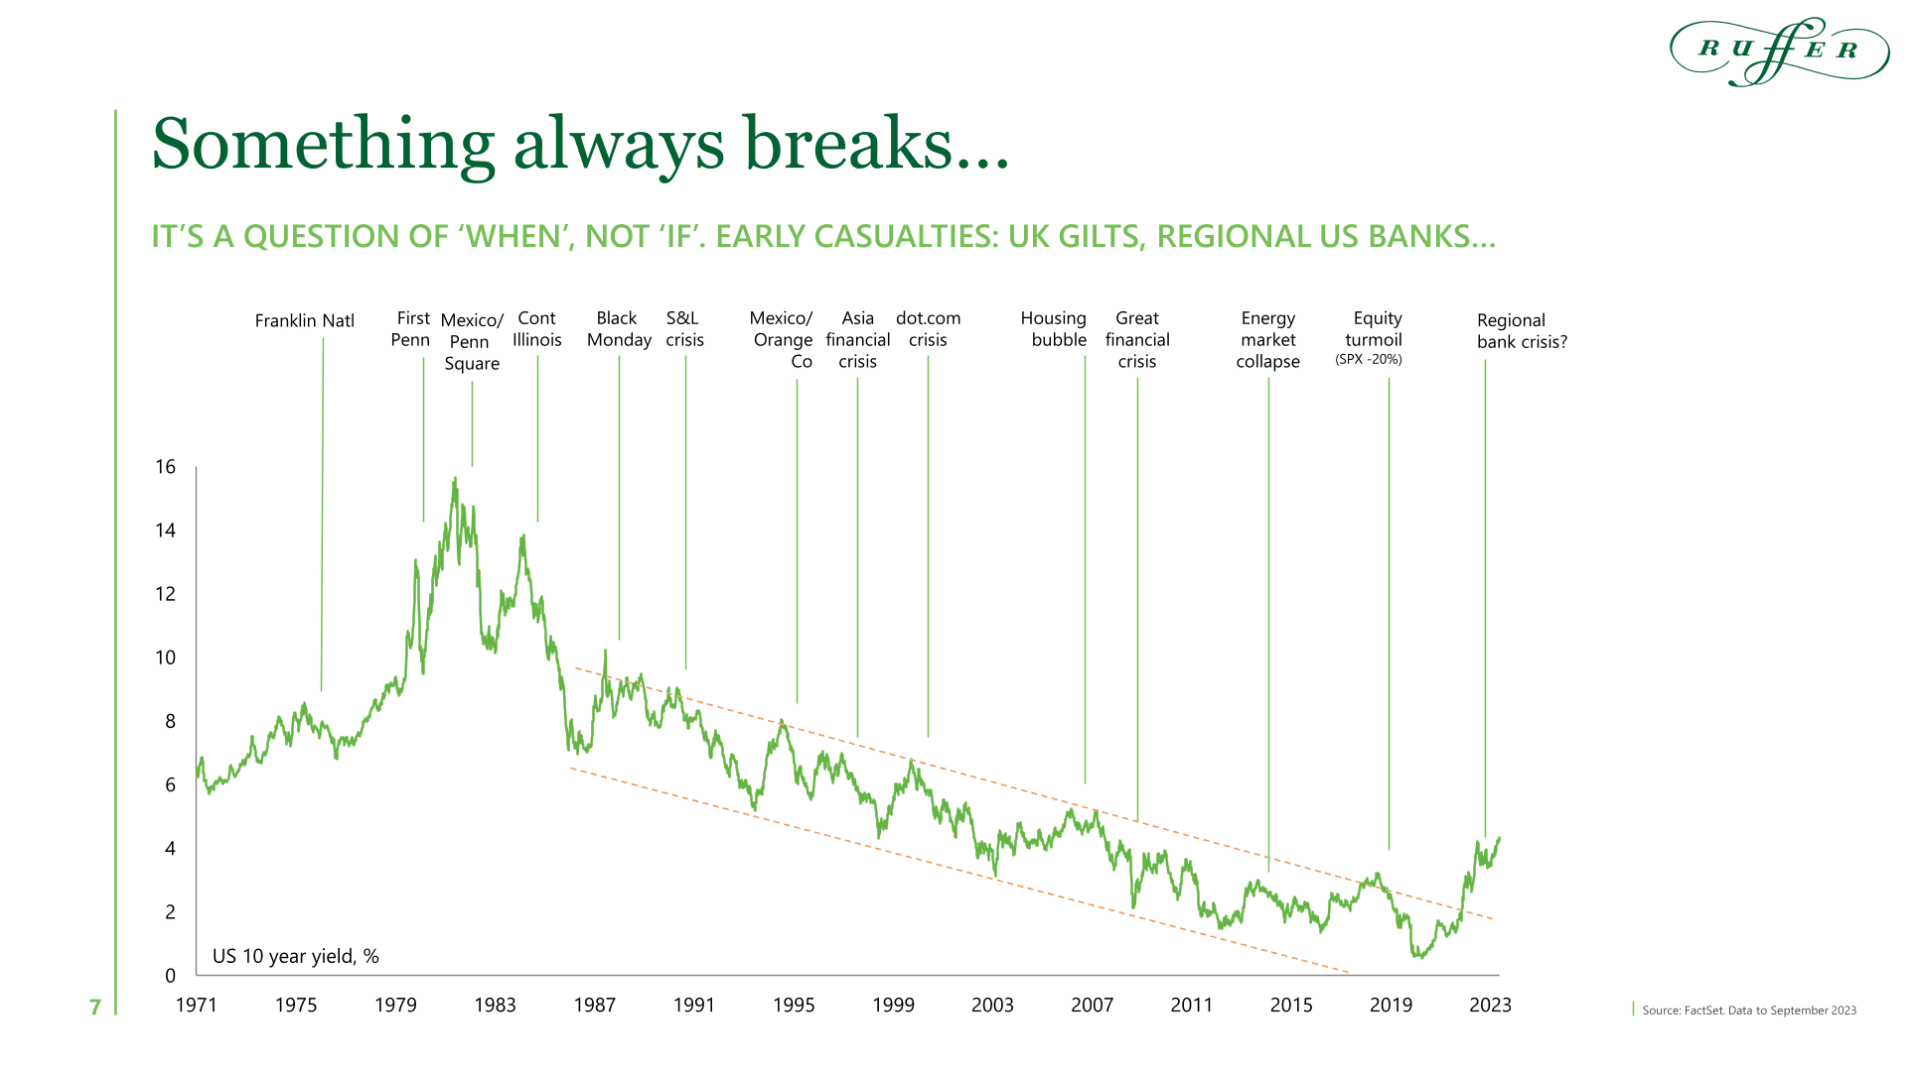
As our friends at Ruffer put it, something always breaks, or, in Swiftese, “all these things will catch up to you”.
So, what should investors do?
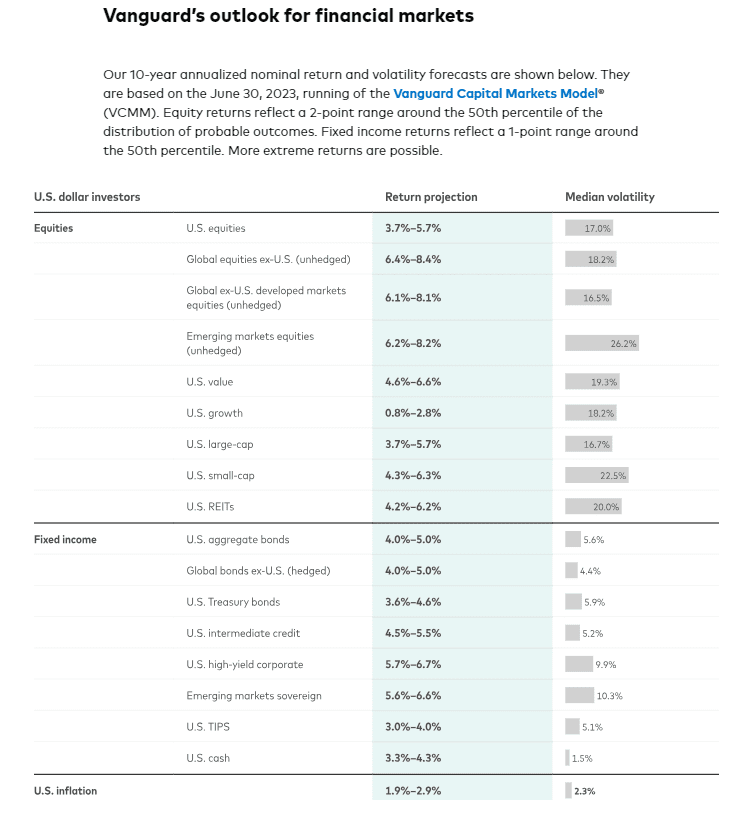
Let’s look to another Swift. Prior to this century, the only Swift most people knew was Jonathan, an even better lyricist than Taylor, in my opinion. Inspired by him, our modest proposal would be to look outside of large cap growth stocks, where investors have flocked for over a decade now. If we look at long-term growth expectations from Vanguard, we see modest return expectations for large cap U.S. stocks, and in fact negative real, i.e., inflation-adjusted, returns for U.S. Growth stocks.
Both Swifts, Taylor and Jonathan, are compelling storytellers. Over the last year, while the best performing stocks have certainly had outstanding earnings, it has really been the stories, e.g., AI, that have resonated with investors.
Whether Jonathan (“It is useless to attempt to reason a man out of a thing he was never reasoned into.”) or Taylor (“I’m damned if I do give a damn what people say.”), Swifts agree that changing people’s minds is difficult. We concur. We write these newsletters, have a podcast, meet with industry professionals, and yet, it always comes back to most “investors” not even really thinking.
Martin Kelly, CFO of asset management behemoth Apollo Global nicely summarized this phenomenon on a recent call (emphasis is ours), “And the last focus on is this notion of indexation and correlation. 80% of volume today of trading is S&P 500, 60% of our markets are ETFs. Ten stocks compose nearly 35% of the S&P 500. These 10 stocks are responsible for approximately 100% of year-to-date returns. These 10 stocks have traded between 52 and 44 PE over the last few weeks. Not many of you come in every day, looking to buy 50 PE stocks. Yet we feel really comfortable with a massive portion of our country’s retirement system assets and fiduciary assets in 50 PE stocks.
We have literally never had so much concentration in so few instruments since the Nifty 50 going back and predates my career. But if one looks at the data from that period of time, a decade later investors lost nearly 90% of their money.”
Assets in passive strategies recently hit 50% of total AUM in the U.S. whether by rote or as part of post-GFC regulatory reform, flows into the index continue unabated, with trading in short-dated options providing additional accelerant into this 80% of volume referenced by Kelly. Moreover, as Marc Rowan, Apollo’s CEO asked rhetorically, “what does it mean that public markets are less liquid on the way down.” To us, it means that at any shift in the “buy the dip” mentality, or incremental outflows from index-strategies, will hit an air pocket as active investors would generally not own these stocks at these weights, despite what the S&P Index committee, which is unconcerned with risk management, has to say.
Against this backdrop here is what we are doing for our clients’ portfolios.
- Jonathan Swift is quoted as saying, “blessed is he who expects nothing, for he shall never be disappointed.” We are trying to find stocks where expectations are low, not the 10%-40% growth baked into the price of the Magnificent Seven. We are at a historic level of underperformance for Lilliputian, i.e., smaller stocks; we look for values there, where expectations are low:
- If total returns for equities are expected to be mid-single digits over the long term, we should rely more on dividends to help us hit our return objectives and expect less from multiple expansion or growth. In doing so, we might just not disappoint investors. We look for opportunities among dividend-paying stocks, which have underperformed this year.
- Similarly, if Treasury yields are high on the short end of the yield curve, earning that interest income reflects a nice risk/reward versus the 0.20% yield of the Magnificent Seven and 1.5% on the S&P 500.
Swift wrote disparagingly of a race of quasi-humans he called Yahoos in Gulliver’s Travels. Of them, he wrote, “Yahoos appear to be the most unteachable of all animals” Perhaps another Yahoo, the search engine, is an analog. Per the article, “Yahoo was once the king of the Internet, a $125 billion behemoth.” It was ultimately sold for parts for around $5 billion. Will the same fate befall the current kings of AI? We do not know. Our job is not to predict but the future, but to view the odds and balance risk and reward, and what we would say about the index (and specifically the Magnificent Seven) at this point is only a Yahoo would expect outsized returns from a group of stocks that is already massively expensive. Eventually, you run out of greater fools.
As Stan Druckenmiller states (emphasis ours), “In a pre-QE world, 15 was about normal. When I got in the business, it was 8. Those were the days. It was, like, going into a candy box. I don’t, it seems that bonds are adjusting to a post-QE world. But for some reason, equities haven’t. So, that’s part of the problem. I think, given everything I just talked about and given the geopolitical situation, everything else, I don’t think it is unreasonable to think that we’re not going to continue to sell at 20 times earnings over a long period of time. And then, again, this crowding out of the government sector into the stock market and innovation. Look, I think they’re going to be great companies and great stocks, like a lot to do, stock picker’s market. A lot of people made money in the stock market in the ’70s. It is just not going to be like surfing with a hurricane behind your back. You’re going to have to really do work and figure out, you know, which equities are great, and which are not.”
We, at Formidable, are confident in our ability to do the work.
Part III – Monthly Tactical Update
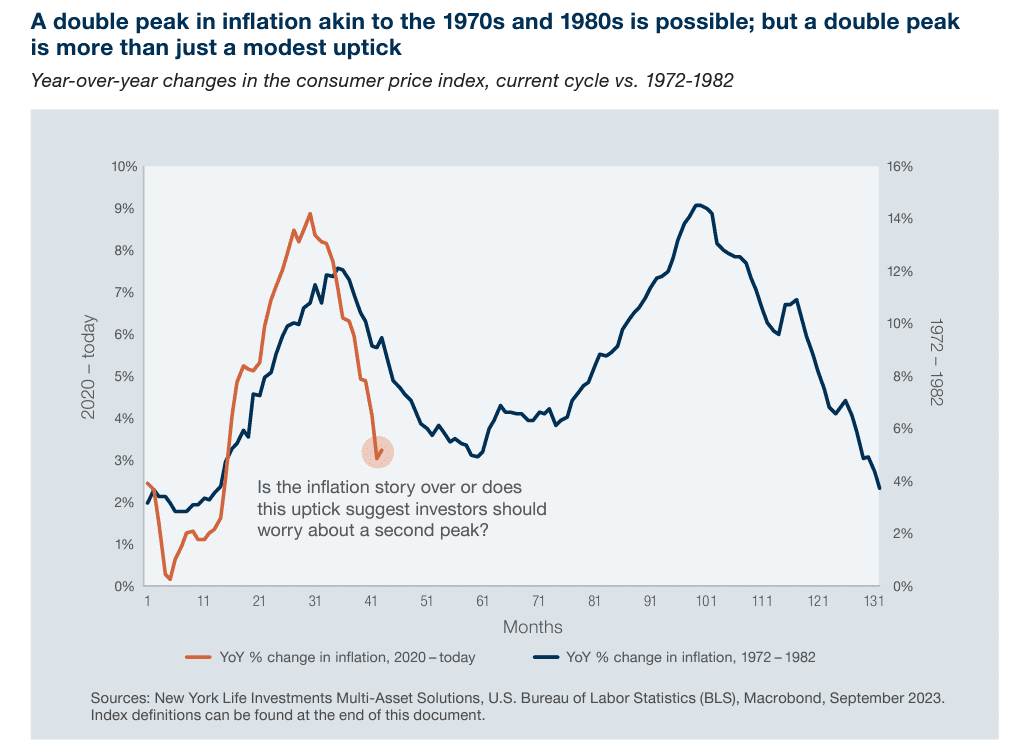
- Inflation – Negative but stable. September core CPI came in at 0.32%, which would annualize to over 3%, which is above the Fed’s target. After slowing over the summer, we have seen inflation begin to accelerate:
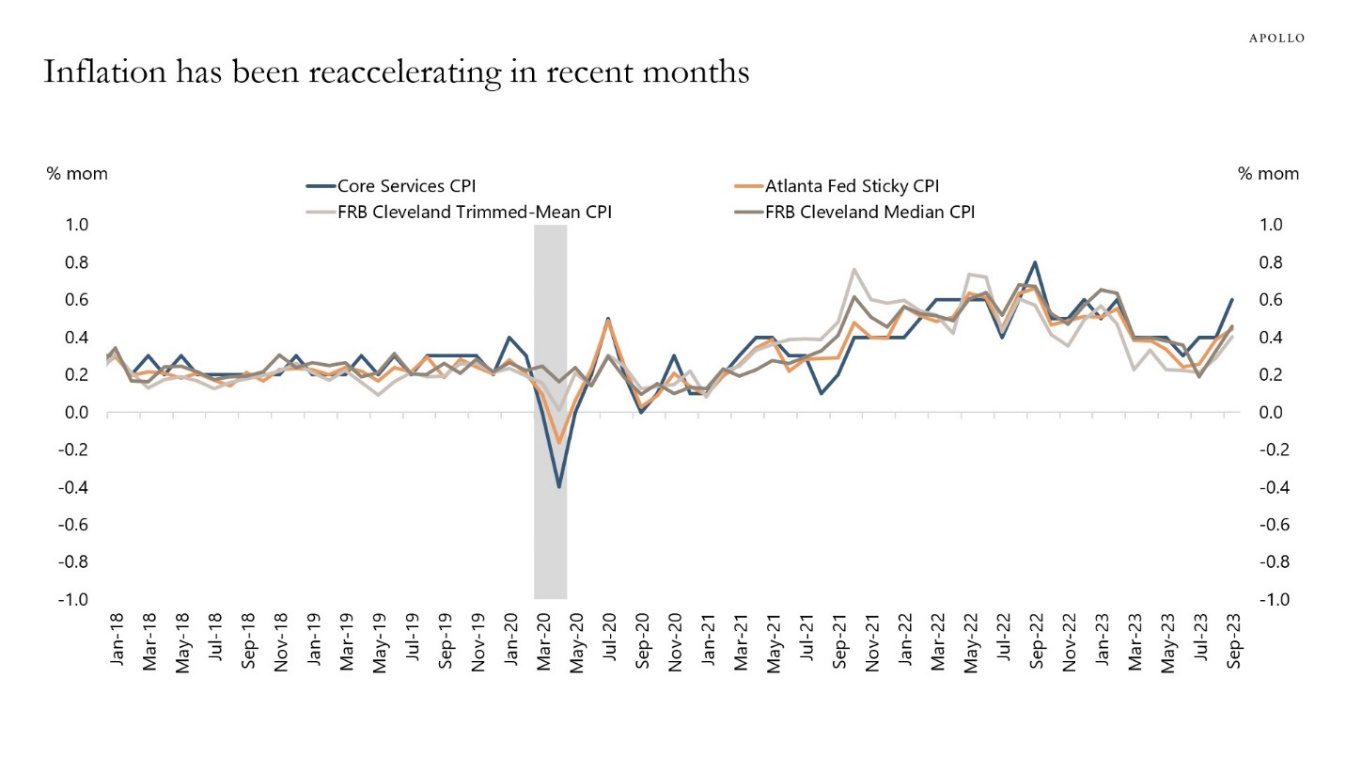
With energy prices moving higher, continued wage pressure as unions hold out for higher compensation, and households expressing consternation about inflation, the risk is that we see a pattern akin to that of the 1970s:
The 1970s double-top was in large part due to reversing course on monetary policy too quickly, and the Fed is keenly aware of this; more on this in the Fed Policy section:
- GDP Growth – Improving and Neutral. Employment data remains strong, and both nominal and real growth continue to surprise to the upside.
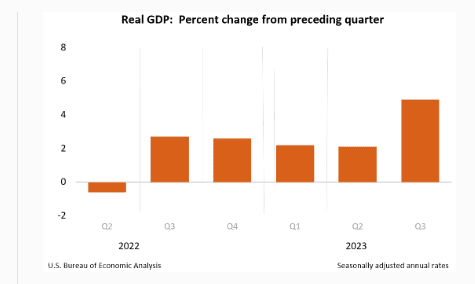
However, we have yet to see any meaningful impact from the Fed’s interest rate increases, which are not expected to really hit hard until Q4 ’23 and beyond.
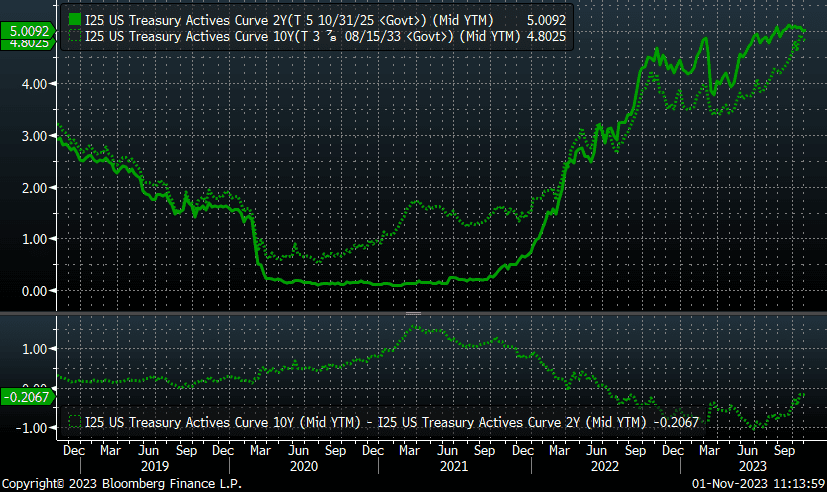
Our key metric for economic health is the 10-2 curve. Where this goes from a yellow light to a red light is when we go from inverted (where we are now) to uninverted. A quarter ago, we were at over 1% inverted; we are now at 0.20%, thanks to the dotted green line (the 10-year Treasury interest rate) rocketing higher. If the dark green line (the two-year Treasury) dips below the dotted line, that yellow light often turns red from a recession (and often market) perspective:
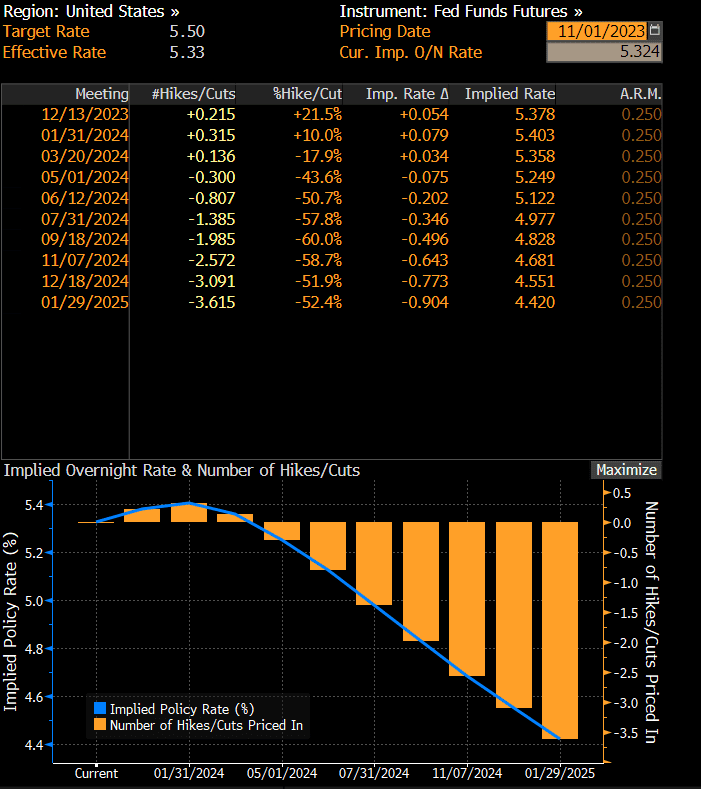
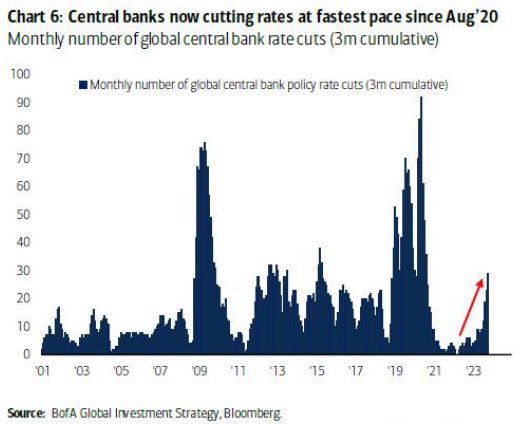
- Fed Policy – Negative but stable. The Fed knows all about the mistakes of the 1970s. Despite strong economic data, odds of a hike this year are less than one in three. However, odds of a cut keep getting pushed farther into 2024, i.e., higher for longer is the consensus.
On the other hand, as noted previously, the Fed’s bond purchases have declined, which is serving to push rates on the longer end, e.g., 10-year Treasuries, higher. However, globally, central banks are starting to panic:
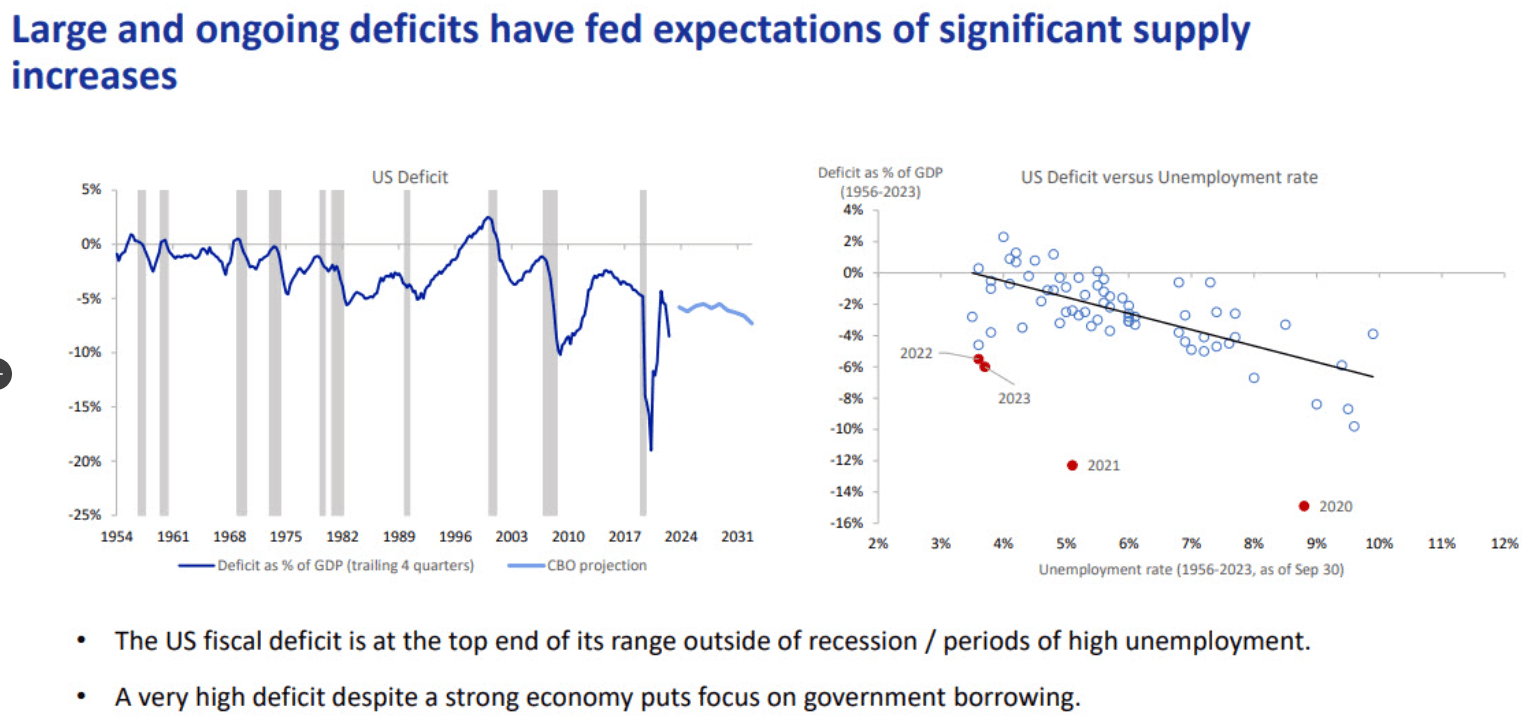
- Interest rates – Negative but stable. The 10-year Treasury yield stabilized after a spike in September but remains troublingly high. The structural set-up for rates in the world of the bond vigilantes remains biased upward, given elevated borrowing in spite of low unemployment:
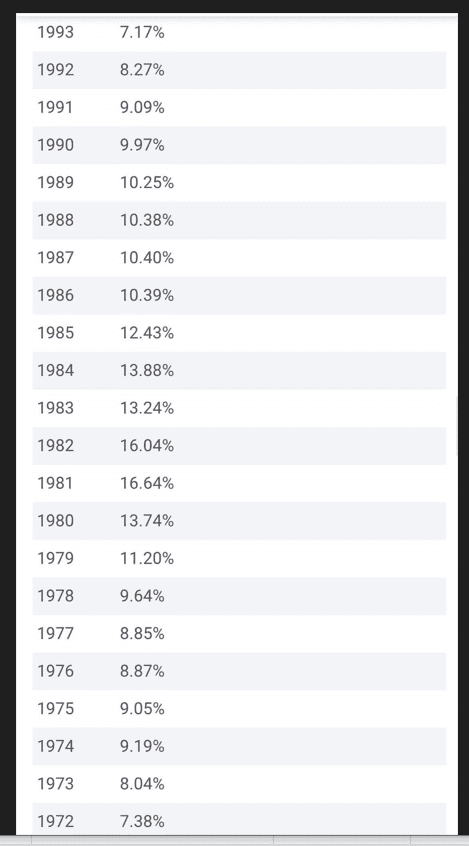
Mortgage rates are suffering from a double whammy of higher rates and higher spreads and are at levels where buying activity is lethargic.
For a frame of reference, here is what mortgage rates looked like historically for purchasers in the 1970s who waited for rates to get back to where they were before buying; it took 21 years (hat tip to one of Will’s high school classmates for this trivia):
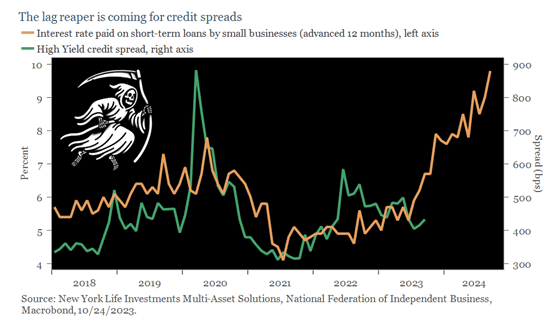
- Credit spreads – Negative but stable. A reminder we use this as a contrarian indicator. In other words, if we see spreads widening into the area above the green line, we may start to view risk/reward more favorably. High-yield spreads remain exactly in-line with their long-term average; investment grade spreads are similarly tight.
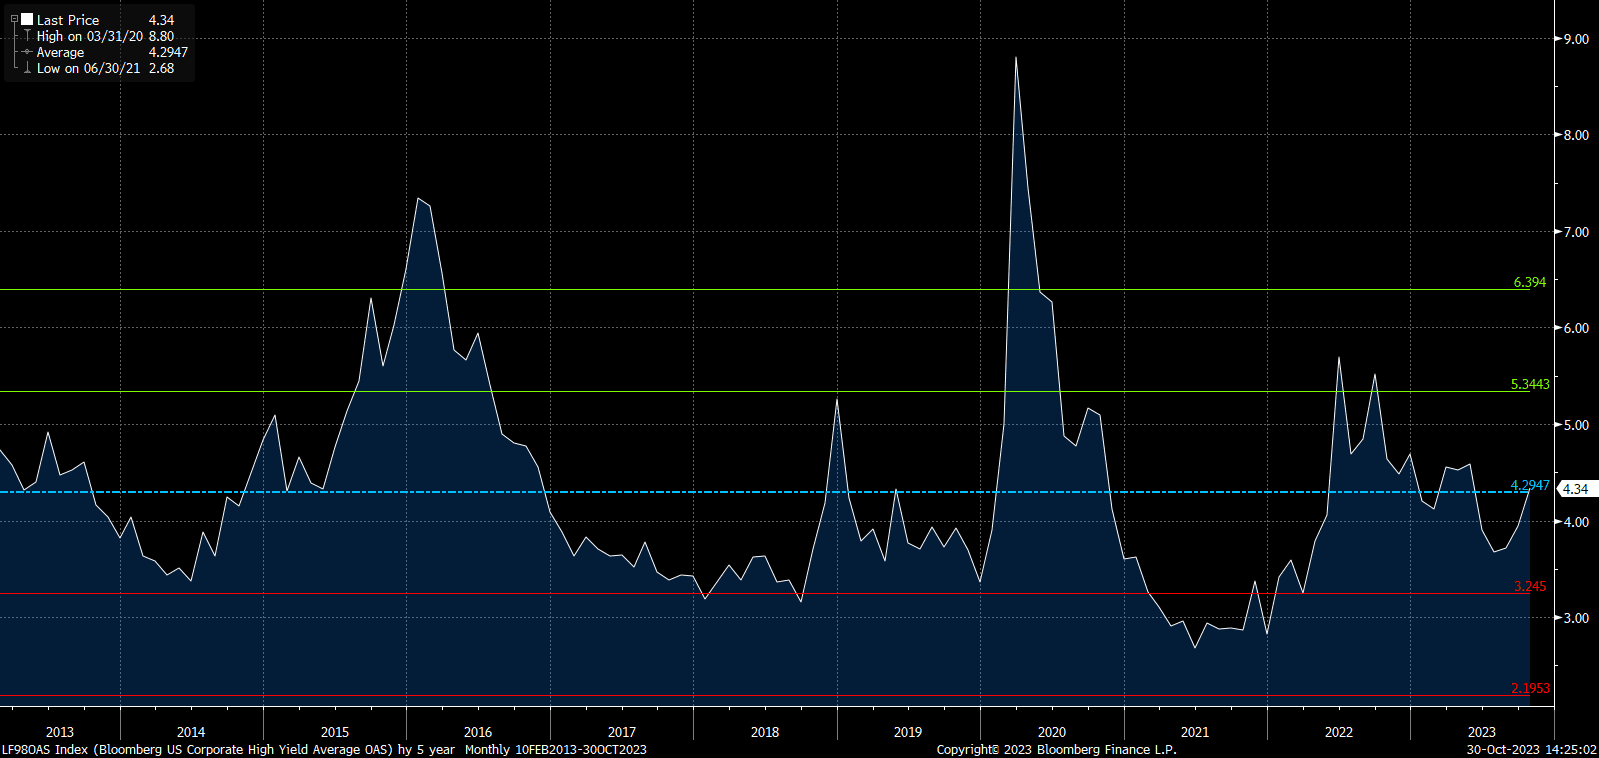
We have seen (and heard) some retail-oriented talking heads advocate for an allocation to high yield bonds based on the high nominal yield. While we acknowledge high yield has de-risked somewhat via shortening duration and does not face a significant wave of refinancings until 2025, we remain cautious as spreads are not wide and historically higher rates have eventually led to higher spreads. After the end of the Fed’s rate increases in 2006, it took two years before credit spreads exploded; in the 2018 rate hike cycle, it was 13 months. We are only at month three for this cycle…
- Stock multiples – Negative but stable. We will state this again: large cap stocks are not cheap at the index level. The top ten stocks are even more overvalued, and the S&P 500 Index is as concentrated as it has even been. The gap between index weight (32%) and earnings contribution (20%) is at a historically wide level as well.
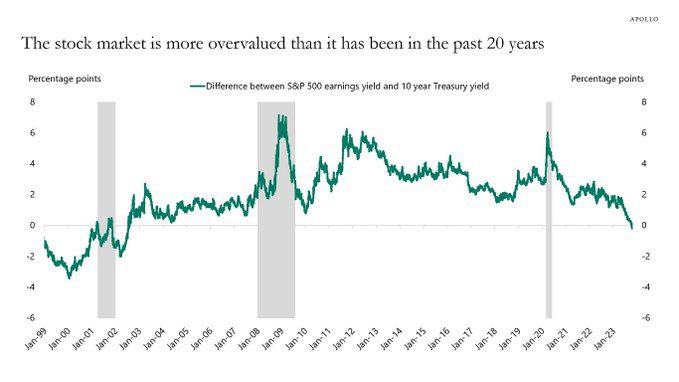
Last month, we showed how stocks were historically expensive versus real, i.e., inflation-adjusted, yields. This month, it is the differences in earnings yield (the inverse of P/E) and 10-Year Treasury yields. Again, we are looking at levels akin to the tech bubble:
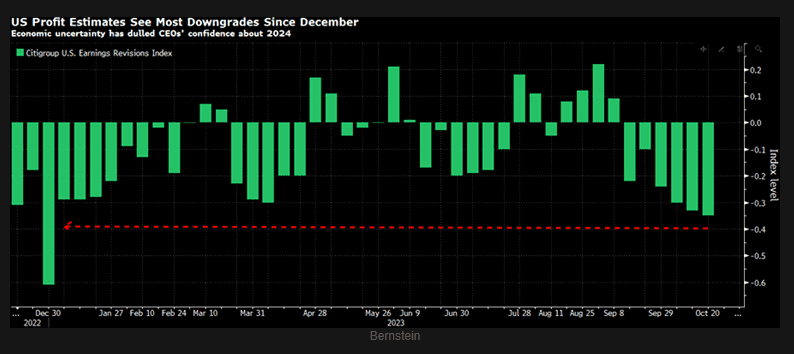
- Earnings growth – Negative but stable. Q3 earnings are 80% complete, with 404 of the 499 stocks in the S&P 500 having reported. The biggest companies (six of the Magnificent Seven) have reported; only Nvidia is yet to report. Both earnings and sales are running relatively flat quarter-over-quarter, and generally positive growth was already baked into price (see the cluster in the southeast quadrant of the scatterplot).
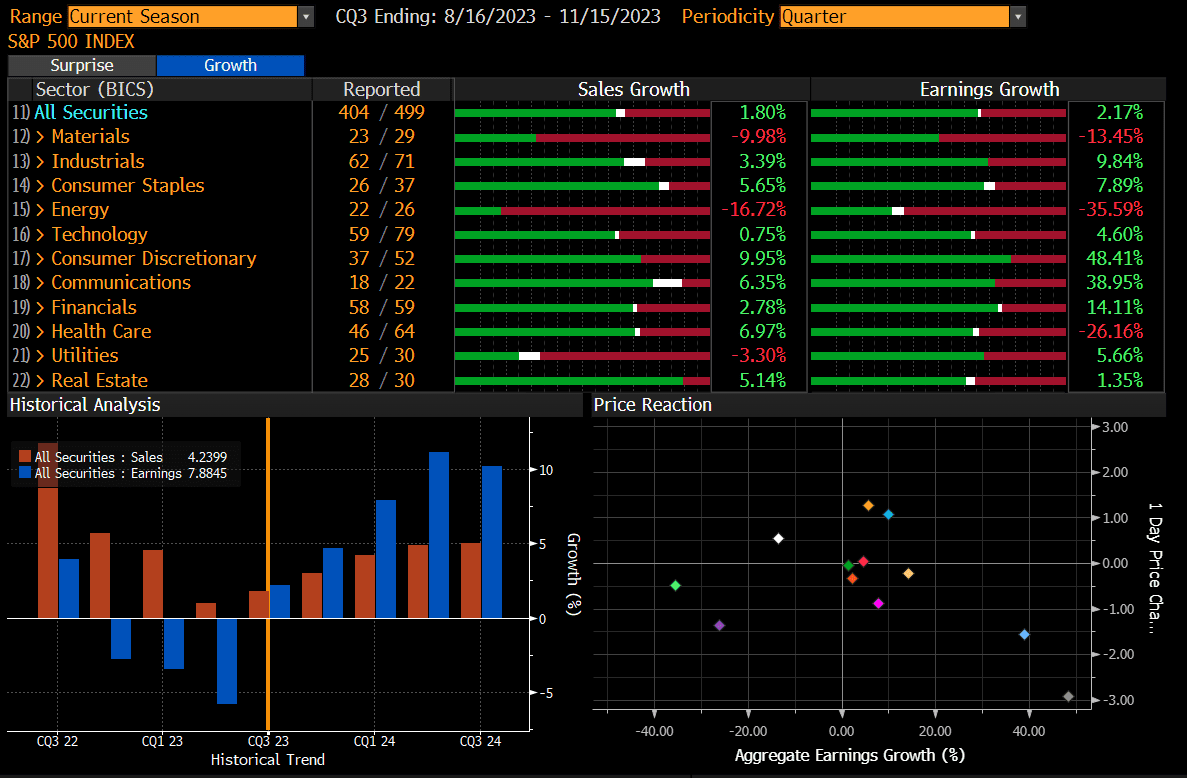
Moreover, confidence in 2024 estimates has waned:
READY TO TALK?