

Adam Eagleston, CFA
Chief Investment Officer
October Update: Crucible of War
Normally, these newsletters have a consistent theme, but this month is a just a hodgepodge of things that came together for me, personally, on a single day.
October Update – Key Takeaways
- Bond vigilantes pushed U.S Treasuries into a historic decline in September.
- The end of 2023 may be a crucible for investors.
- Events in the Middle East are eerily similar to prior flashpoints that have devolved into wider conflagrations.
September Recap – Vigilante Justice
A few days ago, we were having a lunchroom debate about the career path of Mark-Paul Gosselaar, a.k.a., Saved by the Bell’s Zack Morris. Little did I know he was one of the lead actors in Found, which my wife started watching. One exchange on the show involved the pejorative use of the term vigilante, so I decided to write about the return of the bond vigilantes, only to find the Financial Times had beaten me to it.
For those younger readers, a bond vigilante’s role, per Ed Yardeni, who coined the term, is “So if the fiscal and monetary authorities won’t regulate the economy, the bond investors will. The economy will be run by vigilantes in the credit markets.” He wrote this in 1983. The vigilantes had been relegated to the dustbin of history until the last few months.
Since semantics and etymology are two of my favorite things, we should note that the term comes from Latin vigilare, a verb meaning “to wake.” The Romans were known to chant, “Mars, vigila!” to wake the god of war before battle. Only later did vigilante take on the meaning of punishing crime outside the scope of the law Charles Bronson style (his Death Wish series hit its apex around the same time Yardeni coined the term).
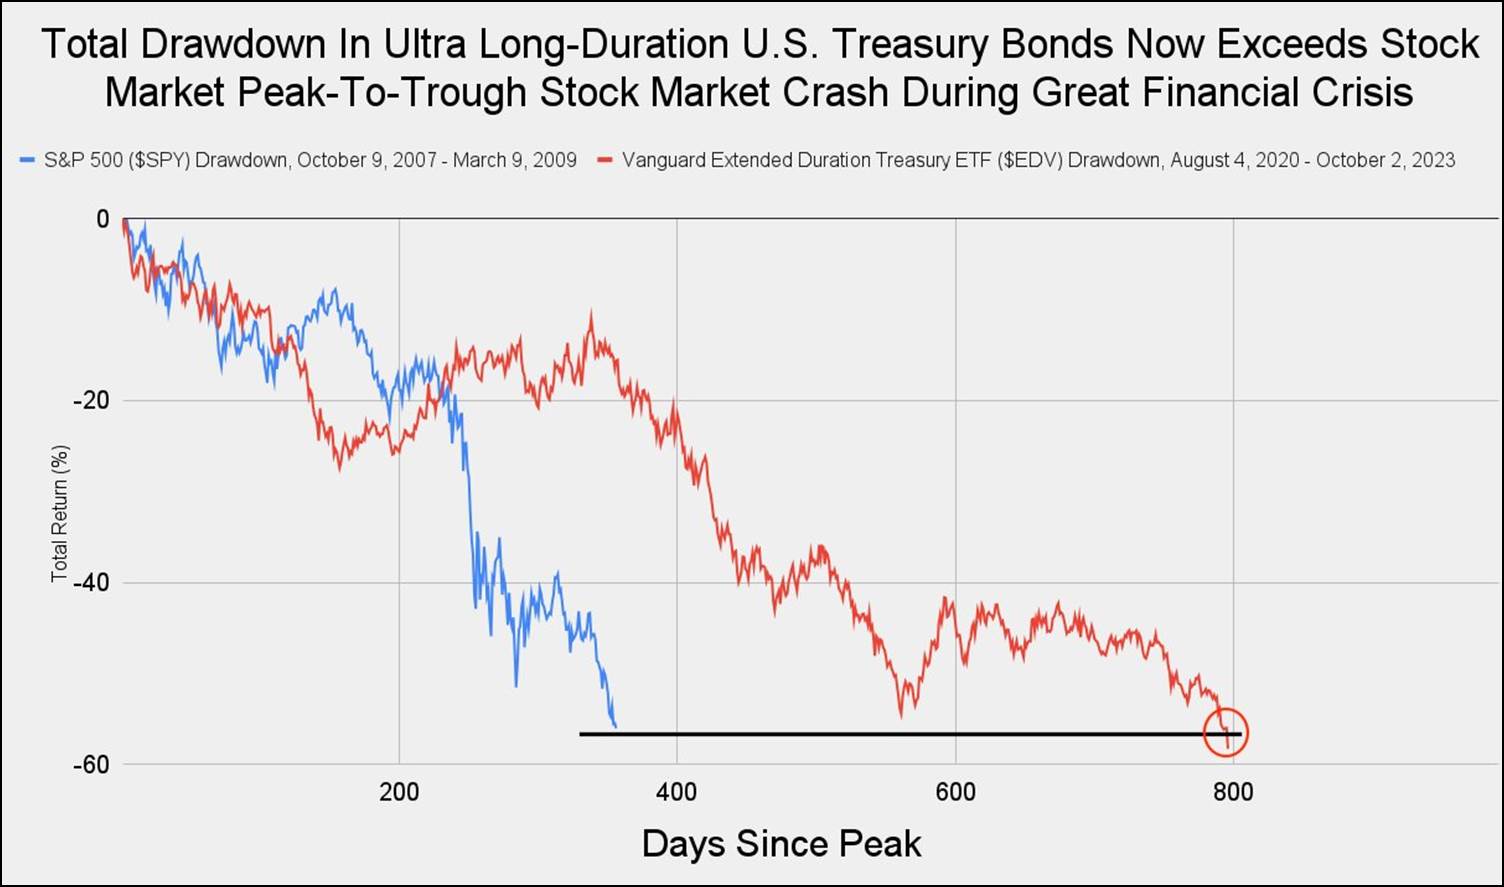
We would argue the vigilantes have both awoken the investment world and punished bond investors recently. The magnitude of the decline is stunning even for those of us who have been doing this for 20+ years.
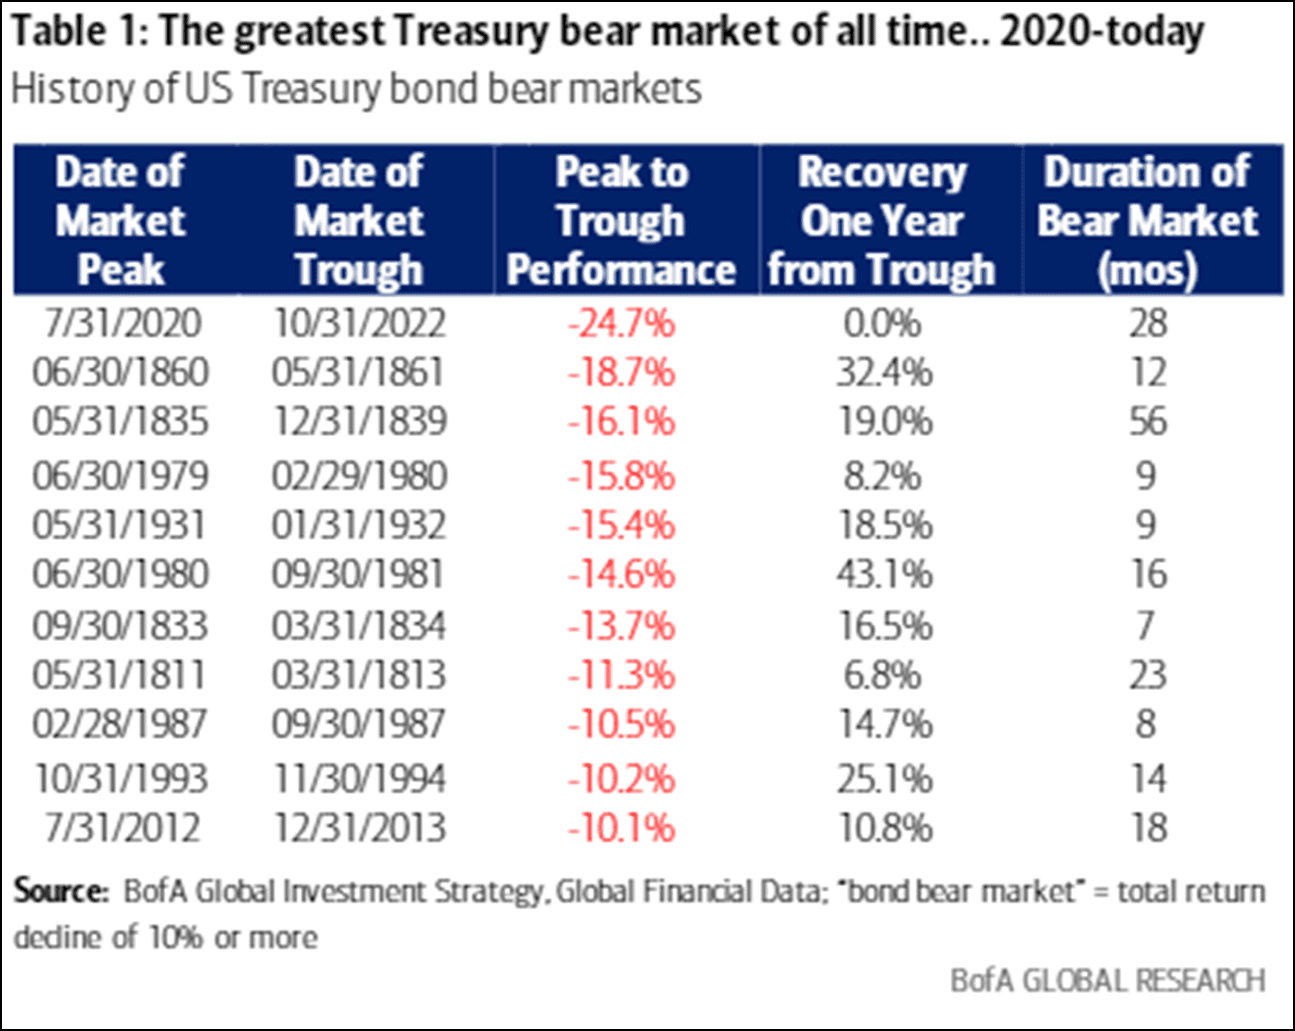
Long-duration U.S. Treasury Bonds, i.e., government bonds maturing in 20 or more years, have declined in value as much as stocks did during the financial crisis. Granted, it has taken longer, but the capital depreciation in an asset backed by the full faith and credit of the U.S. government is some wake-up call, as is being in a worse market for government debt than at the outbreak of the Civil War.
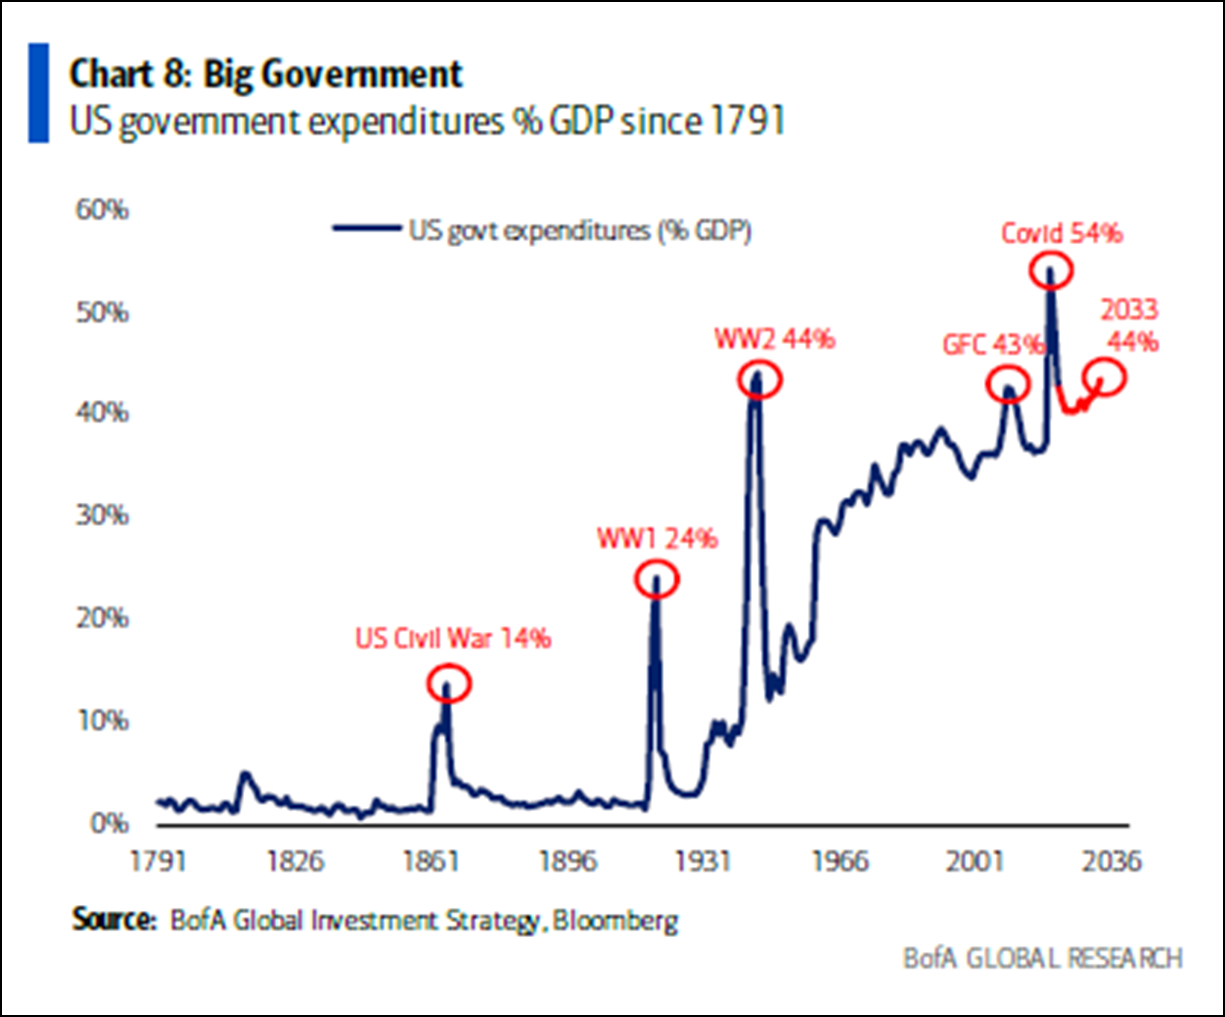
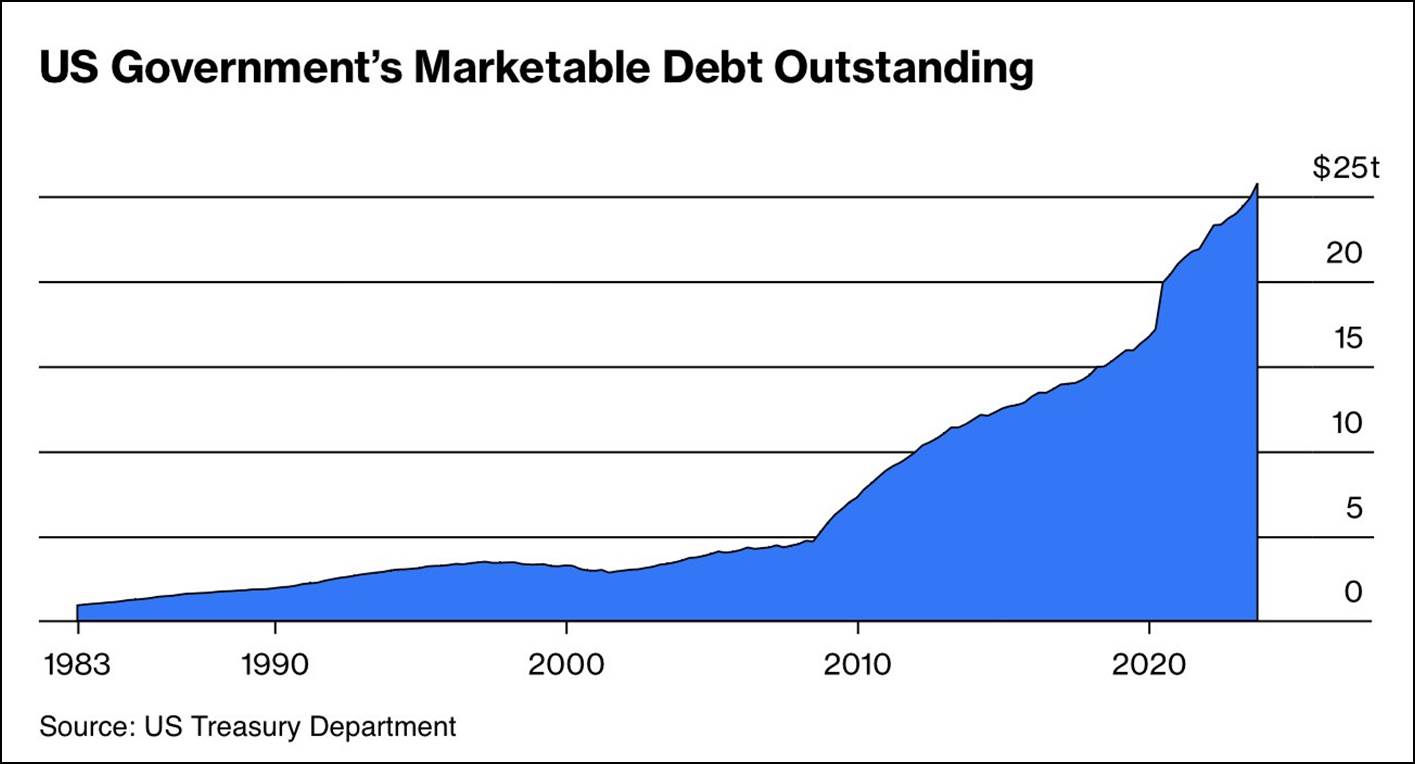
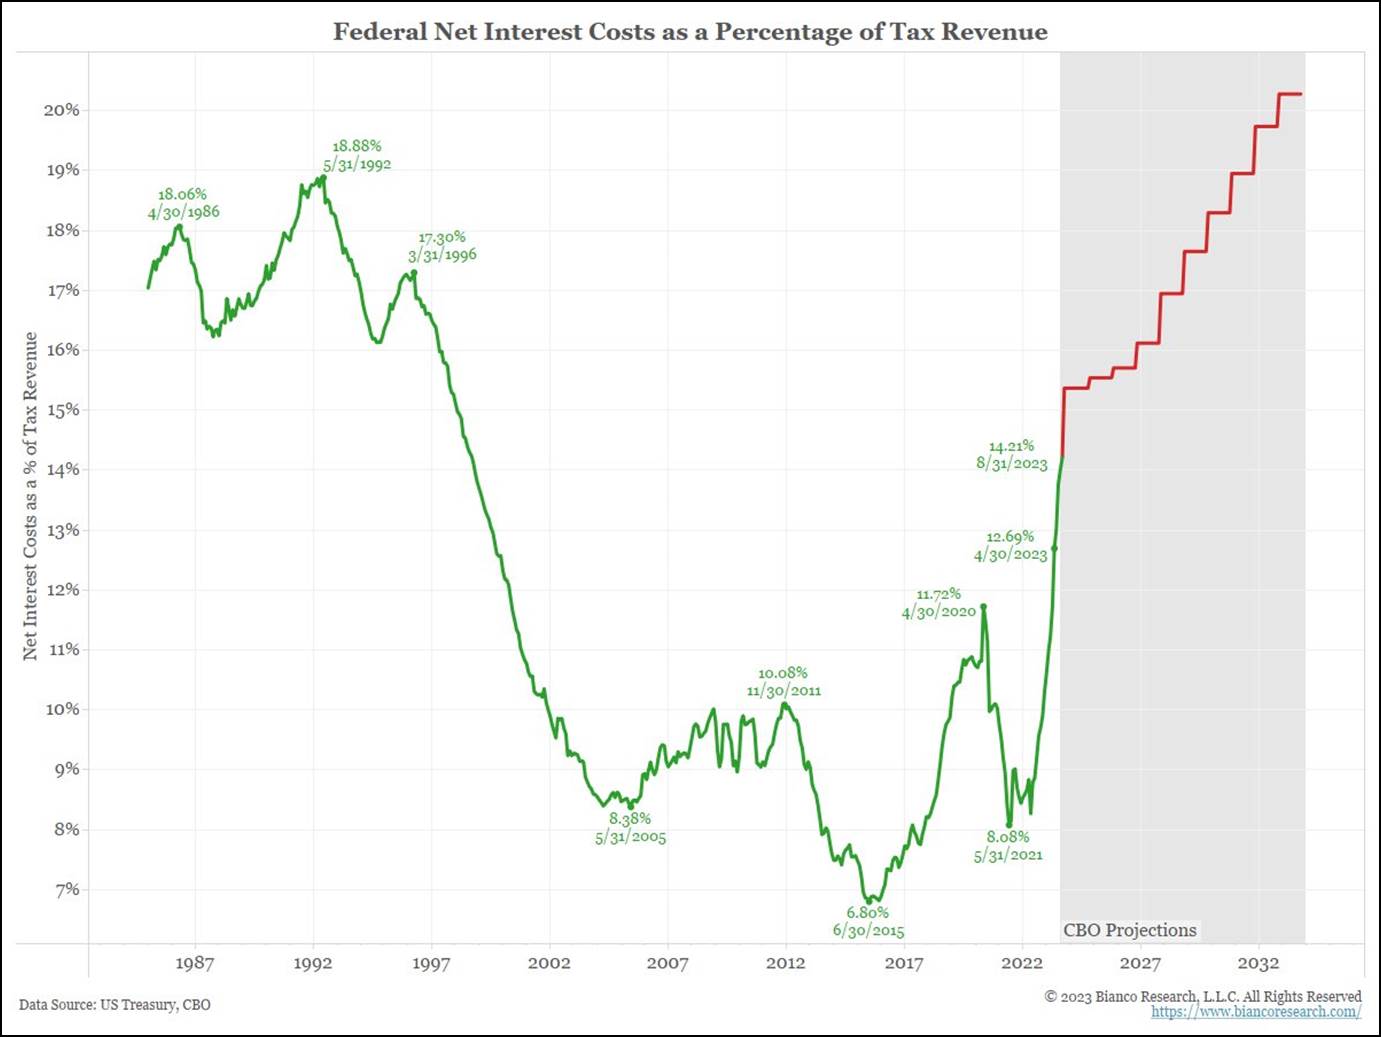
Yardeni mentions fiscal and monetary authorities. Let us look at each one in turn in terms of the share of blame in bringing back vigilante justice. The fiscal side is clearly culpable. The government only recently averted a shutdown, and the current deficit (at a higher percentage of GDP than during World War II), when combined with an already staggering level of debt, makes for grim viewing. With interest rates now higher, interest expense is anticipated to consume nearly 20% of tax revenues within the next decade.
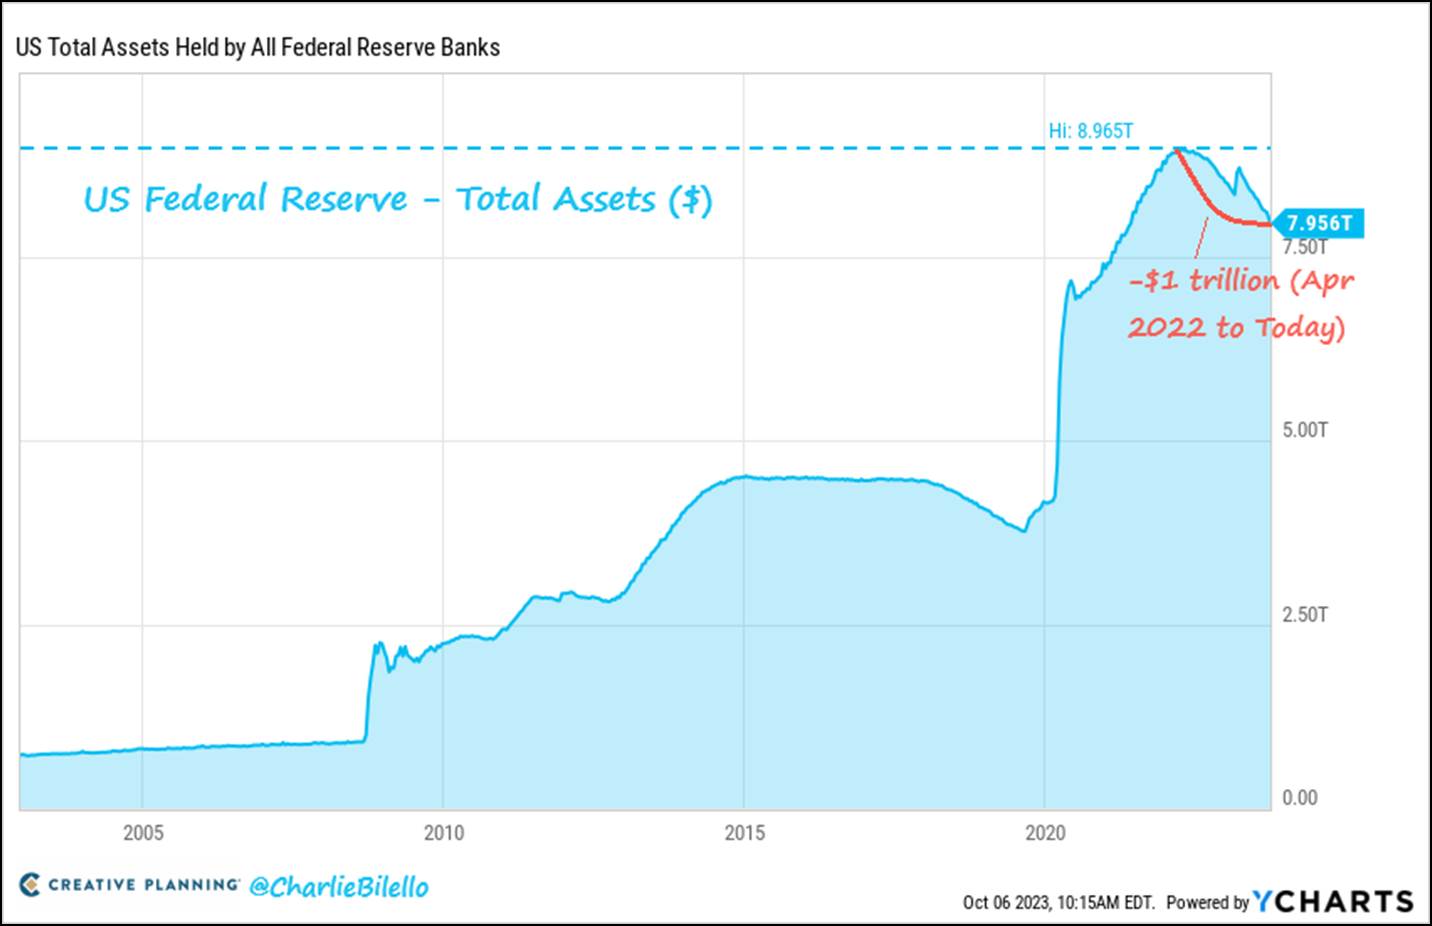
However, perhaps the vigilantes are the Fed itself, which has been rapidly reducing the size of its holdings of government debt (albeit from elevated levels) as well as steadily increasing interest rates.
Regardless of whether the vigilantes are independent actors or part of the machinery of monetary policy, the impact on investors in September was profound. Commodities, thanks primarily to soaring oil prices, were the only positive asset class in September.
| Index | 1-Month | 3-Month | YTD | 1-Year |
| S&P 500 INDEX | -4.77 | -3.27 | 13.06 | 21.59 |
| Invesco S&P 500 Equal Weight E | -5.08 | -4.90 | 1.69 | 13.32 |
| NASDAQ Composite Index | -5.77 | -3.94 | 27.11 | 26.13 |
| Russell 2000 Index | -5.89 | -5.14 | 2.51 | 8.87 |
| MSCI EAFE Index | -3.38 | -4.04 | 7.63 | 26.37 |
| MSCI Emerging Markets Index | -2.61 | -2.85 | 2.07 | 12.06 |
| Bloomberg US Treasury Total Re | -2.21 | -3.06 | -1.52 | -0.81 |
| Bloomberg US Agg Total Return | -2.54 | -3.23 | -1.21 | 0.64 |
| Invesco DB Commodity Index Tra | 1.50 | 9.96 | 1.26 | 5.02 |
Source: Bloomberg (as of most recent month end)
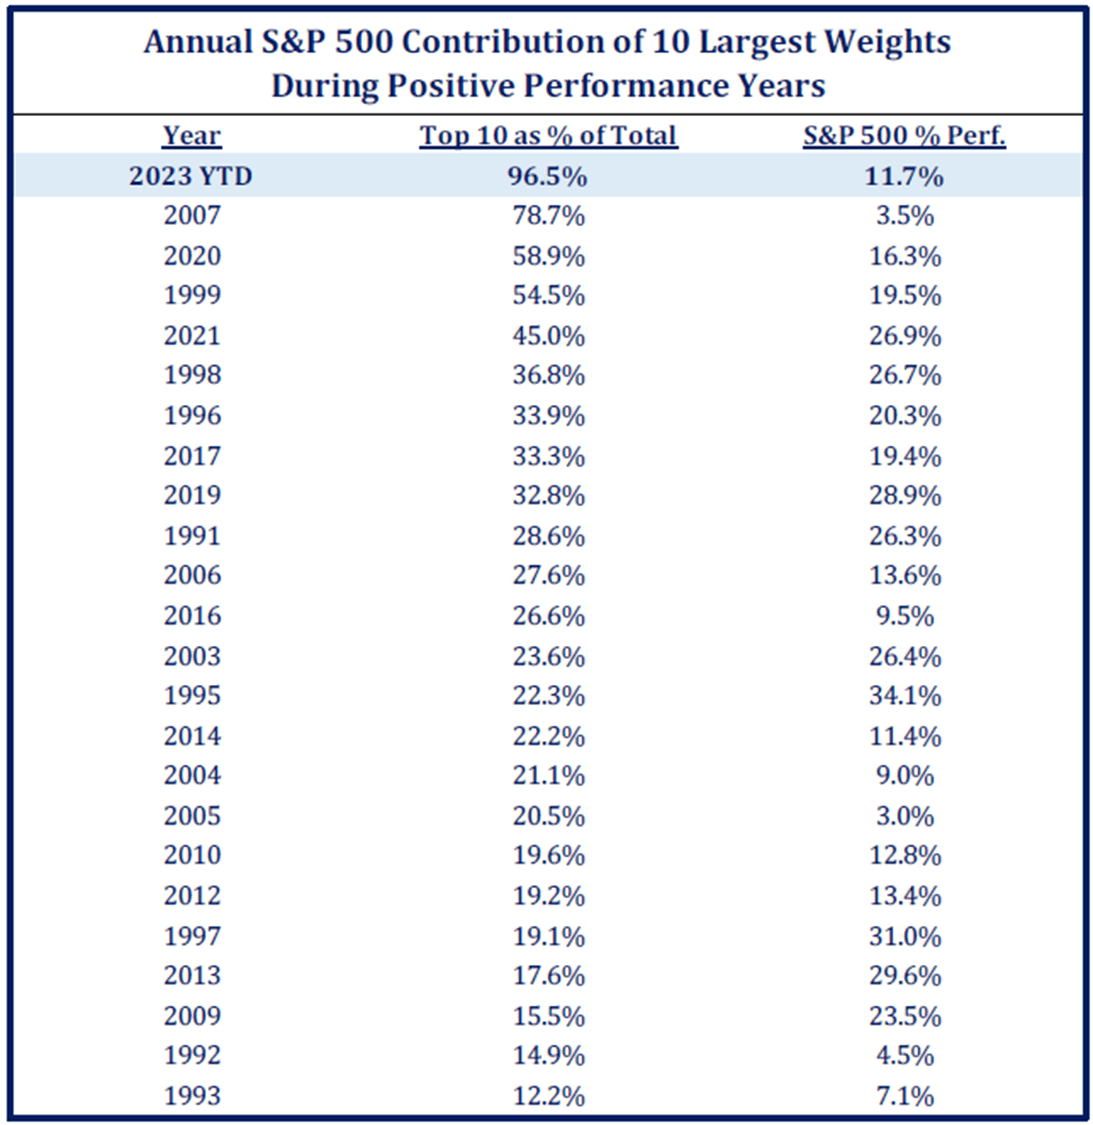
To belabor a point we have made previously, stocks, as a whole, are not healthy. Seven stocks account for the vast majority of the S&P 500’s return, and the ten largest stocks in the index have never accounted for a larger percentage (97%) of the index’s gain in a given year. With 2007 and 1999 being other years with elevated levels of concentration, this causes us concern.
October Outlook – Crucible of War
While Found was playing in the background, I attempted to read Crucible of War, which is about the Seven Years’ War, better known domestically as the French and Indian War. At the current pace, my reading time may equal the duration of the conflict.

As discussed, and unlike in the above scene, the market’s generals have not been mortally wounded. We track a like number of key factors, and those provide the appearance of a crucible for equities wherein, perhaps, the leaders may fall.
| More Negative | Neutral | More Positive | |||
| Inflation | ≈ | ||||
| GDP Growth | ≈ | ||||
| Fed Policy | ≈ | ||||
| Interest Rates | ← | ||||
| Credit Spreads | ≈ | ||||
| Stock Multiples | ≈ | ||||
| Earnings Growth | ≈ | ||||
| Deteriorating | ← | ||||
| Stable | ≈ | ||||
| Improving | → | ||||
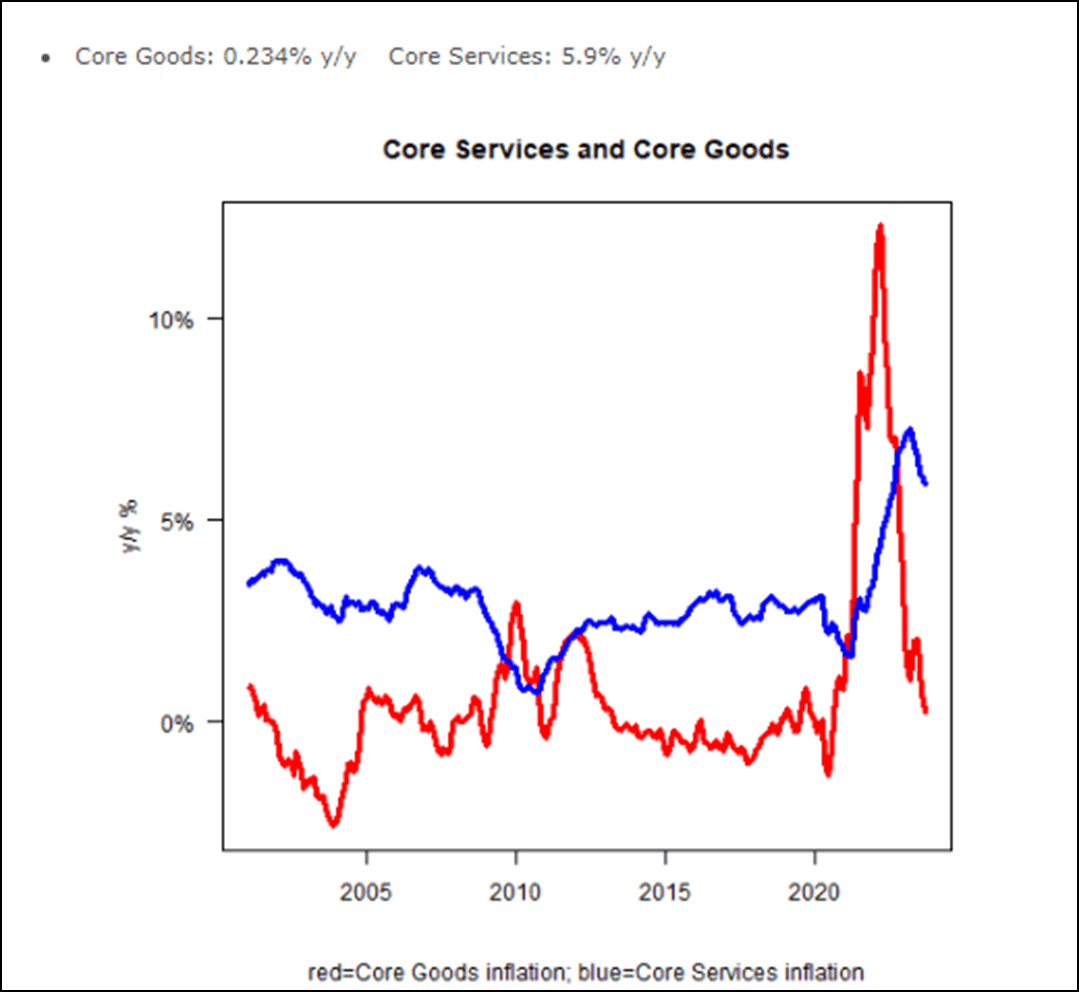
- Inflation – Negative but stable. August core CPI came in at 0.28%, which would annualize to a little over 3%, which is above the Fed’s target. The deceleration seen previously has stopped ,a s we predicted based on the base effects.
Granted, there was good news in the report, with services slowly drastically as rents began to descend, but a lot of work remains to get to 2%.
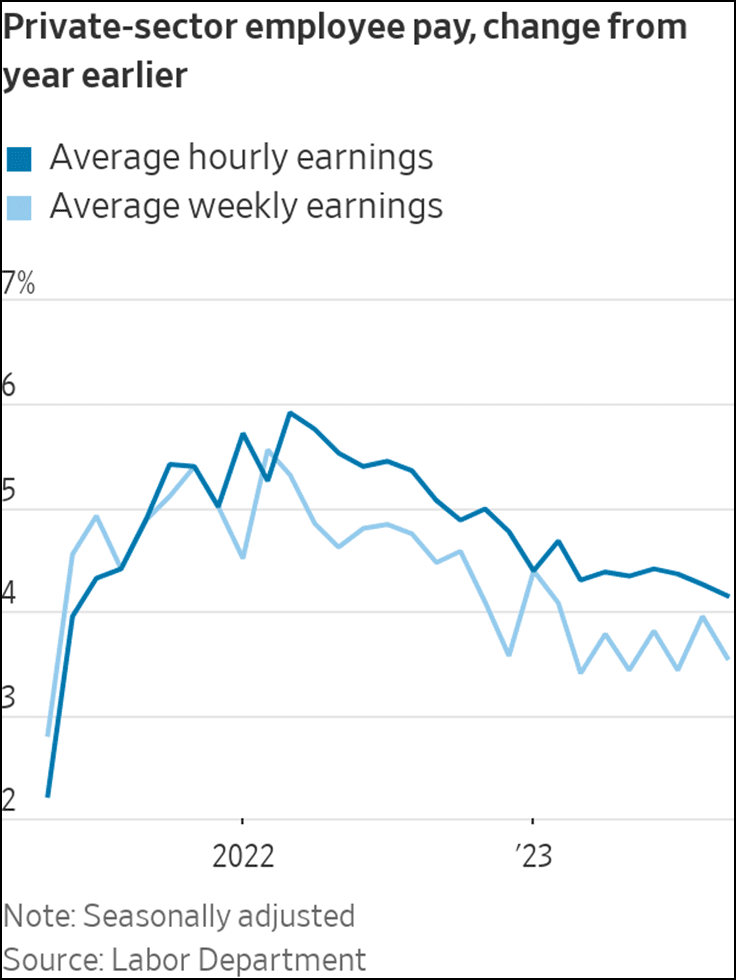
Wage growth is slowing, but with strikes among auto and health workers, can wage inflation continue to decelerate?
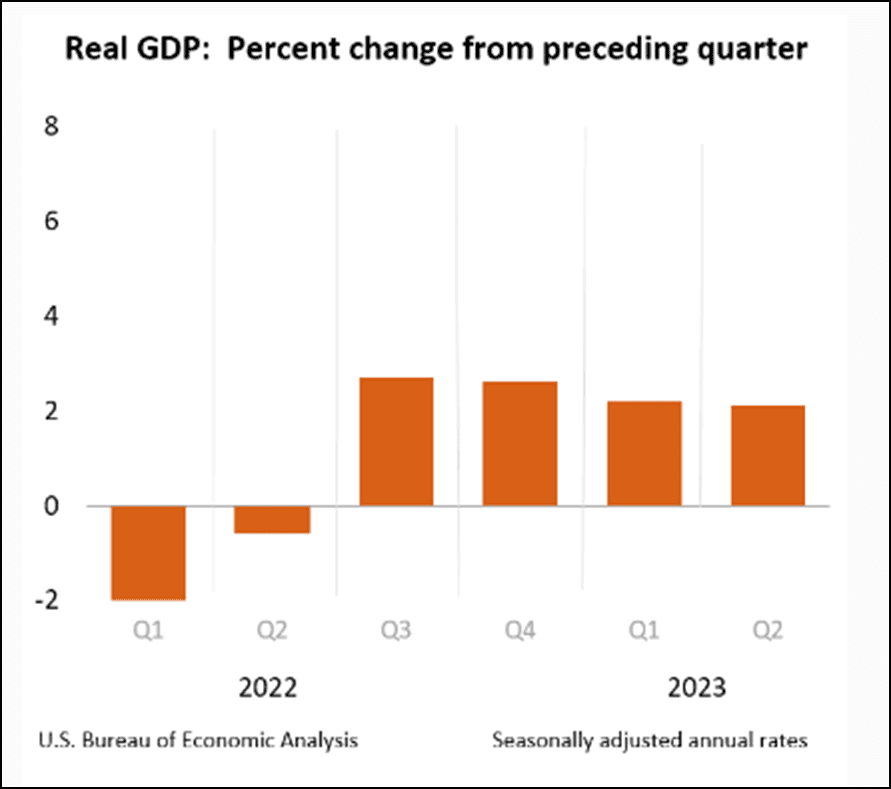
- GDP Growth – Negative but stable. Employment data remains strong, and while nominal growth looks robust, real growth continues to slide, and this is before we see any meaningful impact from the Fed’s interest rate increases, which are not expected to really hit hard until Q4 ’23 and beyond.
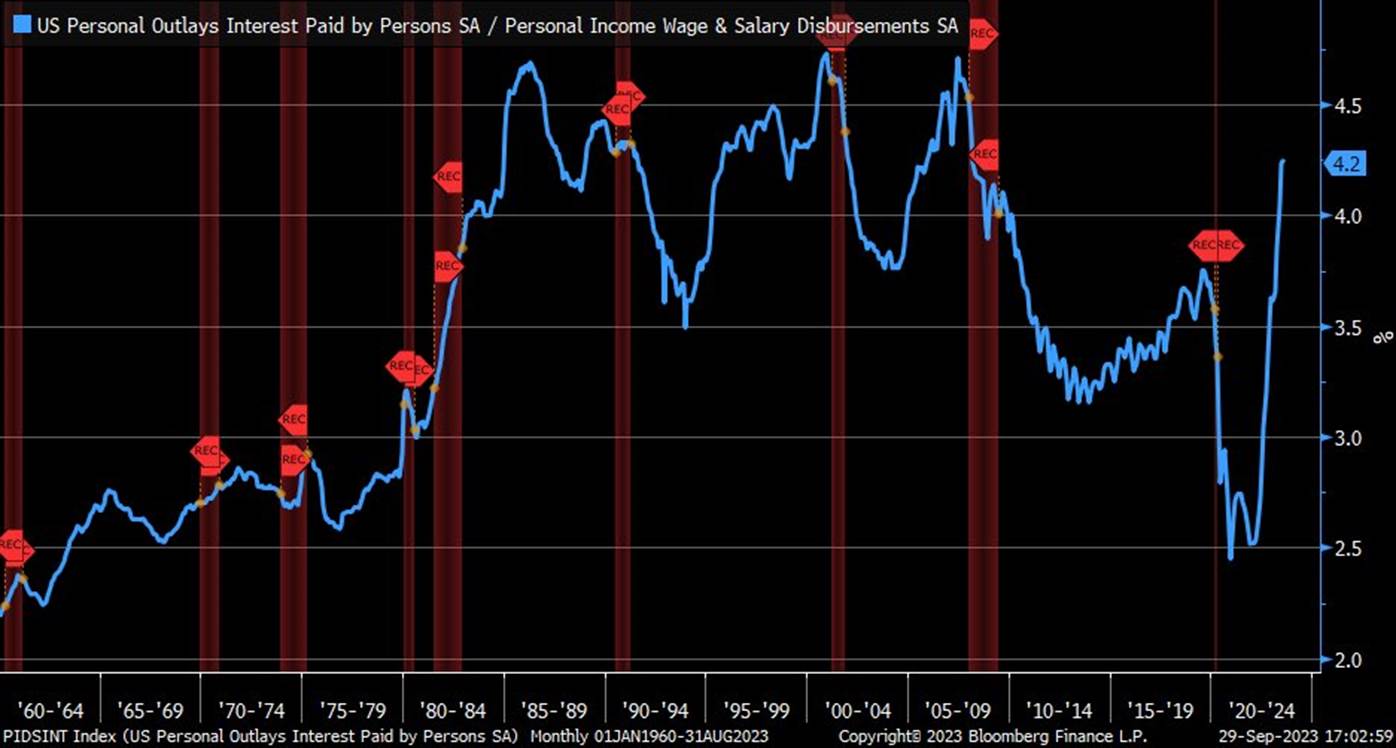
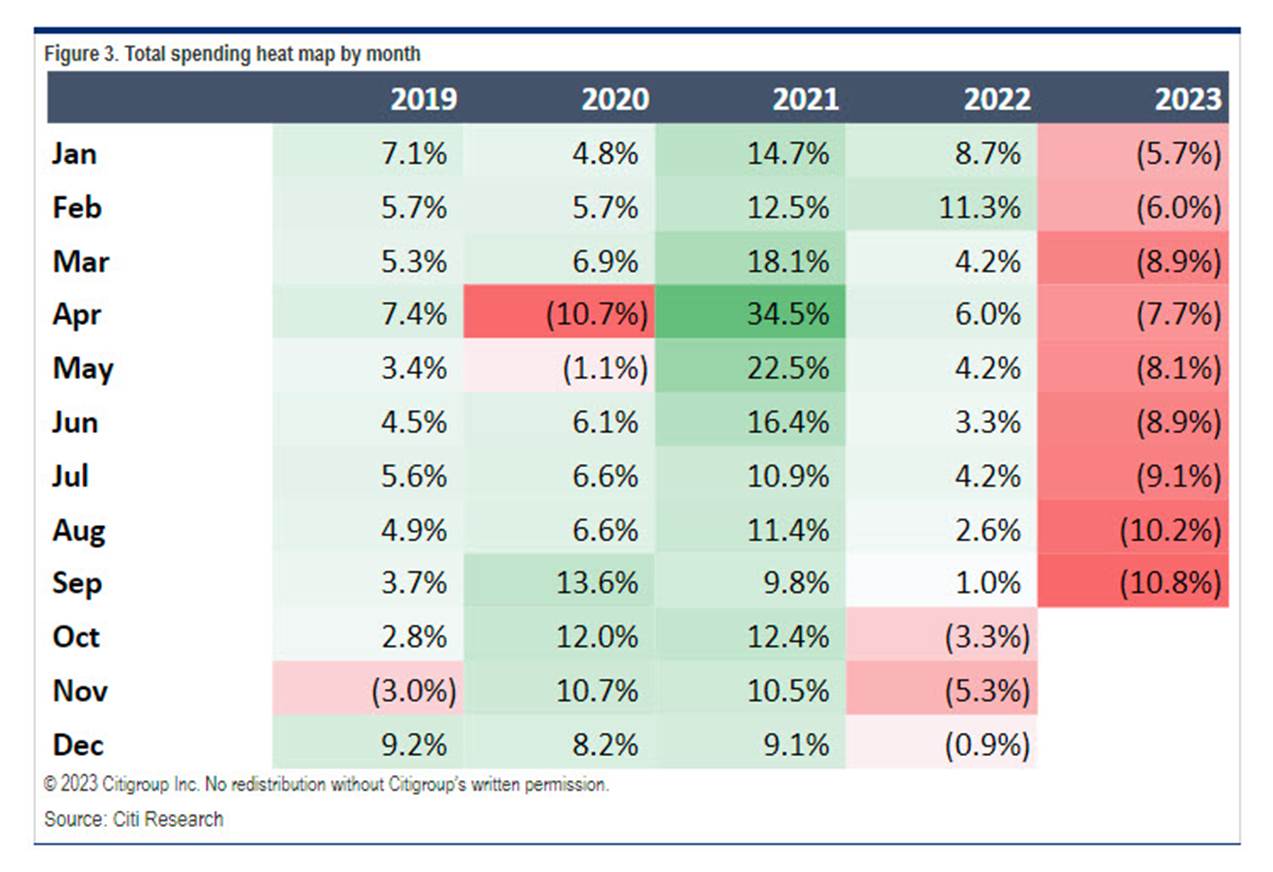
Moreover, consumers, who have played the role of Atlas in keeping the economy aloft, are straining under the burden of higher interest rates, which are now over 4% of wages. Consumer spending is also grinding materially lower.
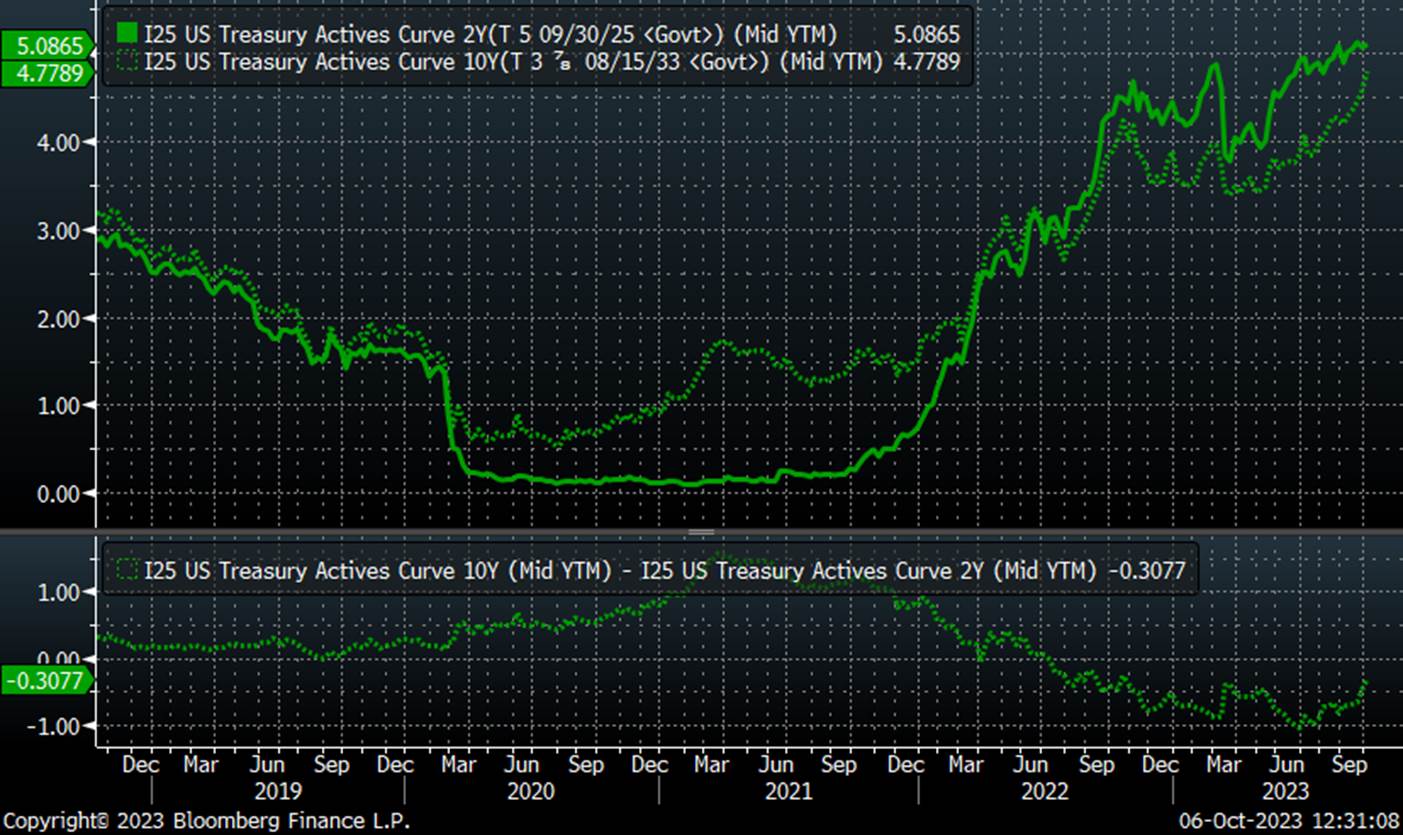
Our key metric for economic health is the 10-2 curve. Where this goes from a yellow light to a red light is when we go from inverted (where we are now) to uninverted. A quarter ago, we were at over 1% inverted; we are now at 0.31%, thanks to the dotted green line (the 10-year Treasury interest rate) rocketing higher. If the dark green line (the two-year Treasury) dips below the dotted line, that yellow light often turns red from a recession (and often market) perspective:
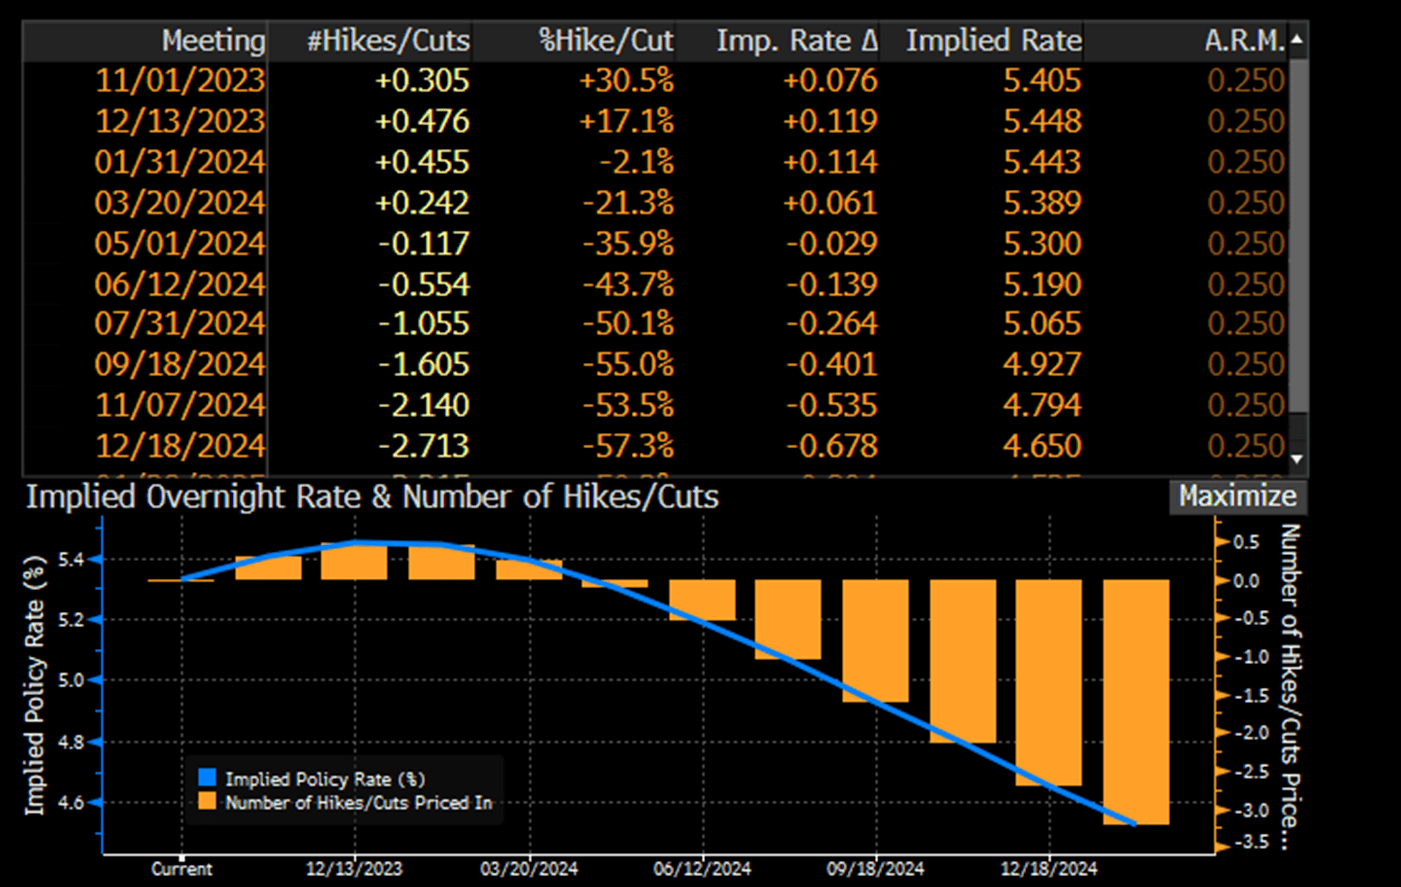
- Fed Policy – Negative but stable. All you really need to know here is “higher for longer” has become the headline. Strong jobs data is not giving any impetus to interest rate cuts in the near term, though odds for another hike this year are also low:
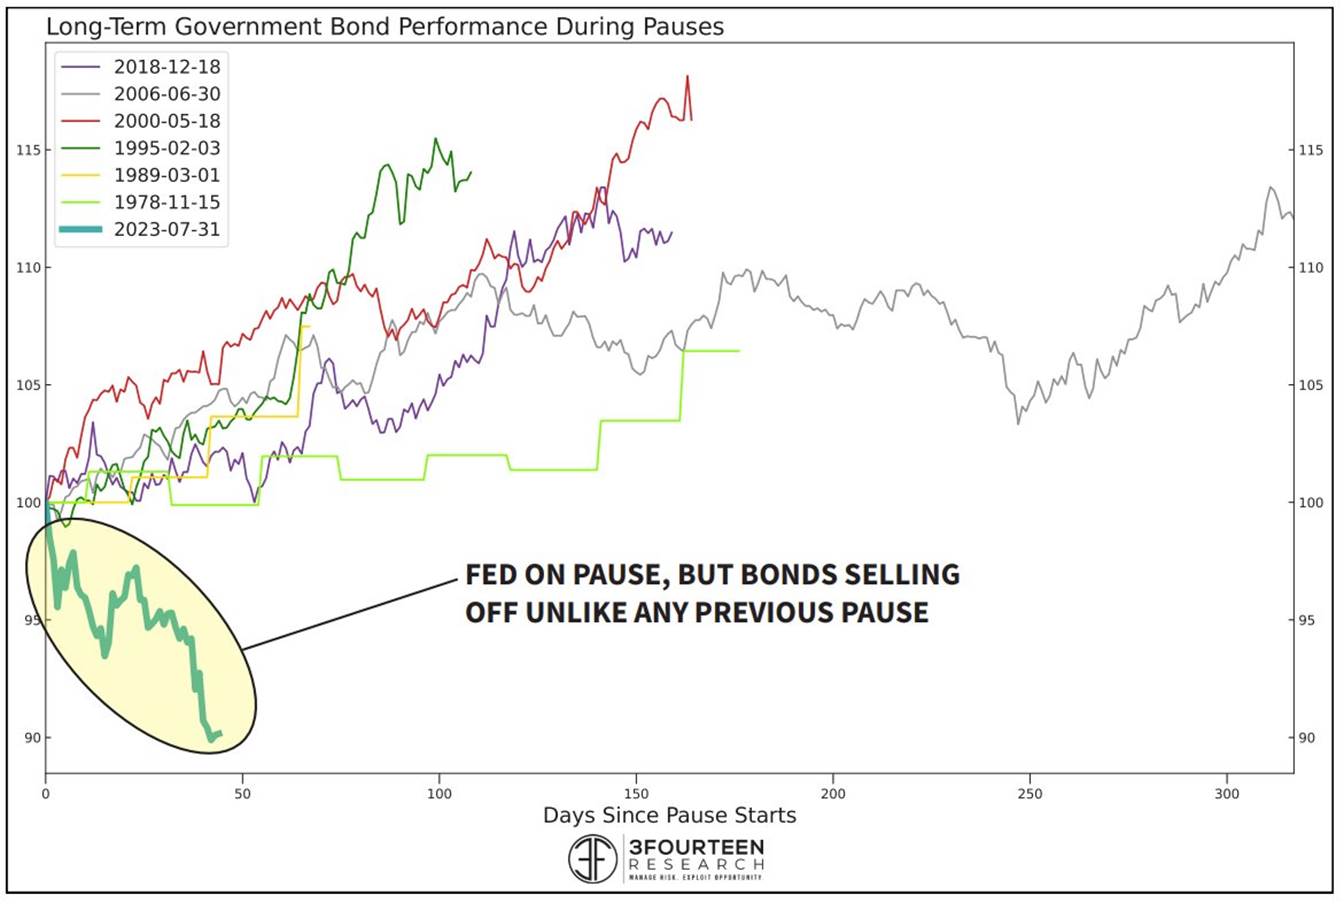
If we are indeed at the point where the Fed pauses, i.e., no imminent hikes or cuts, the reaction of the bond market is without precendent as every other pause has been met with higher bond prices -> lower bond yields:
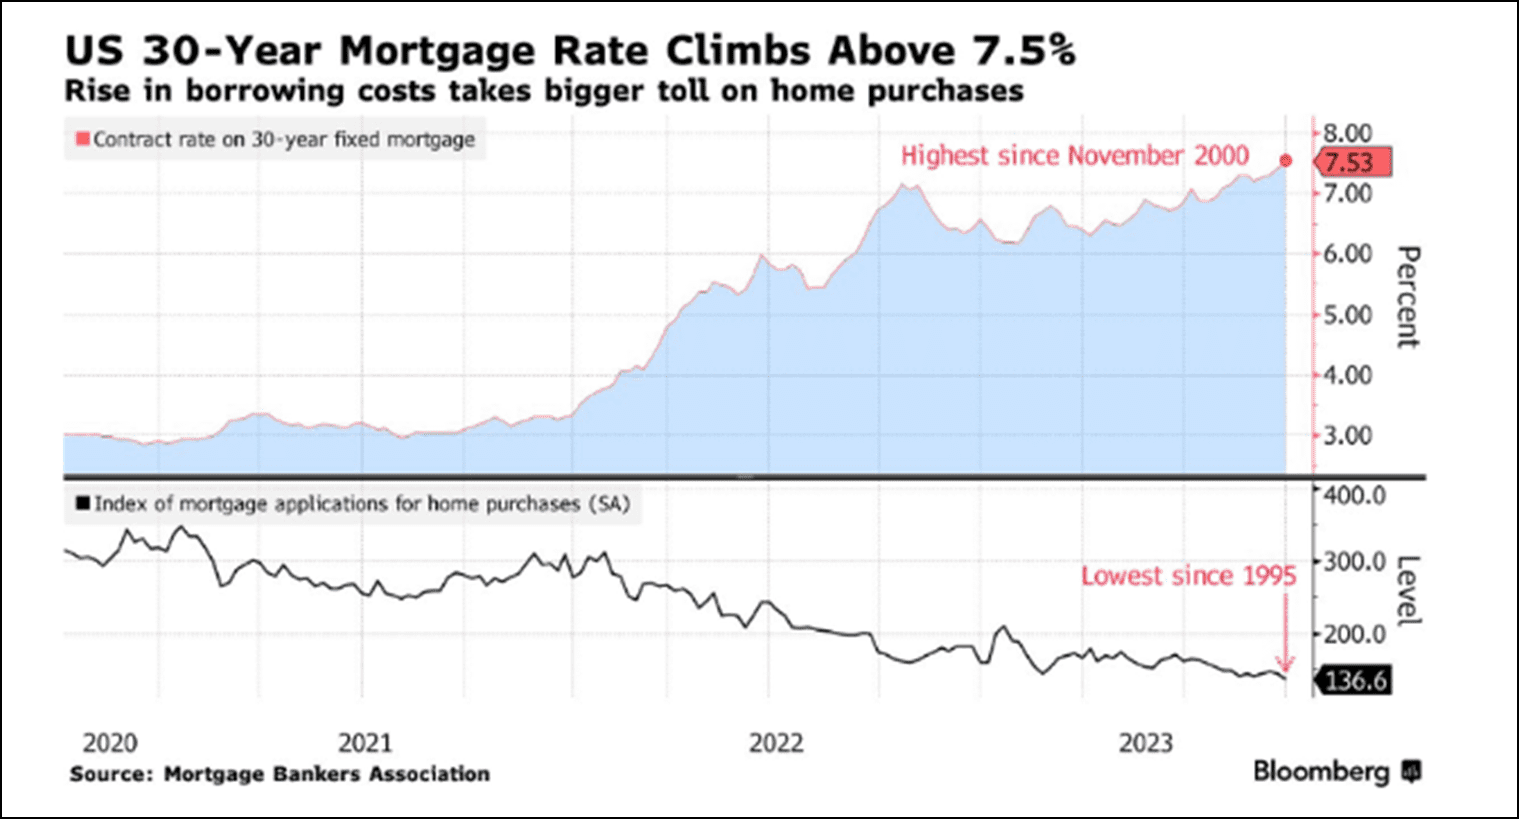
- Interest rates – Negative but worsening. The 10-year Treasury yield move in September is too much to ignore. Mortgage rates are suffering from a double whammy of higher rates and higher spreads and are at levels where buying activity is lethargic.
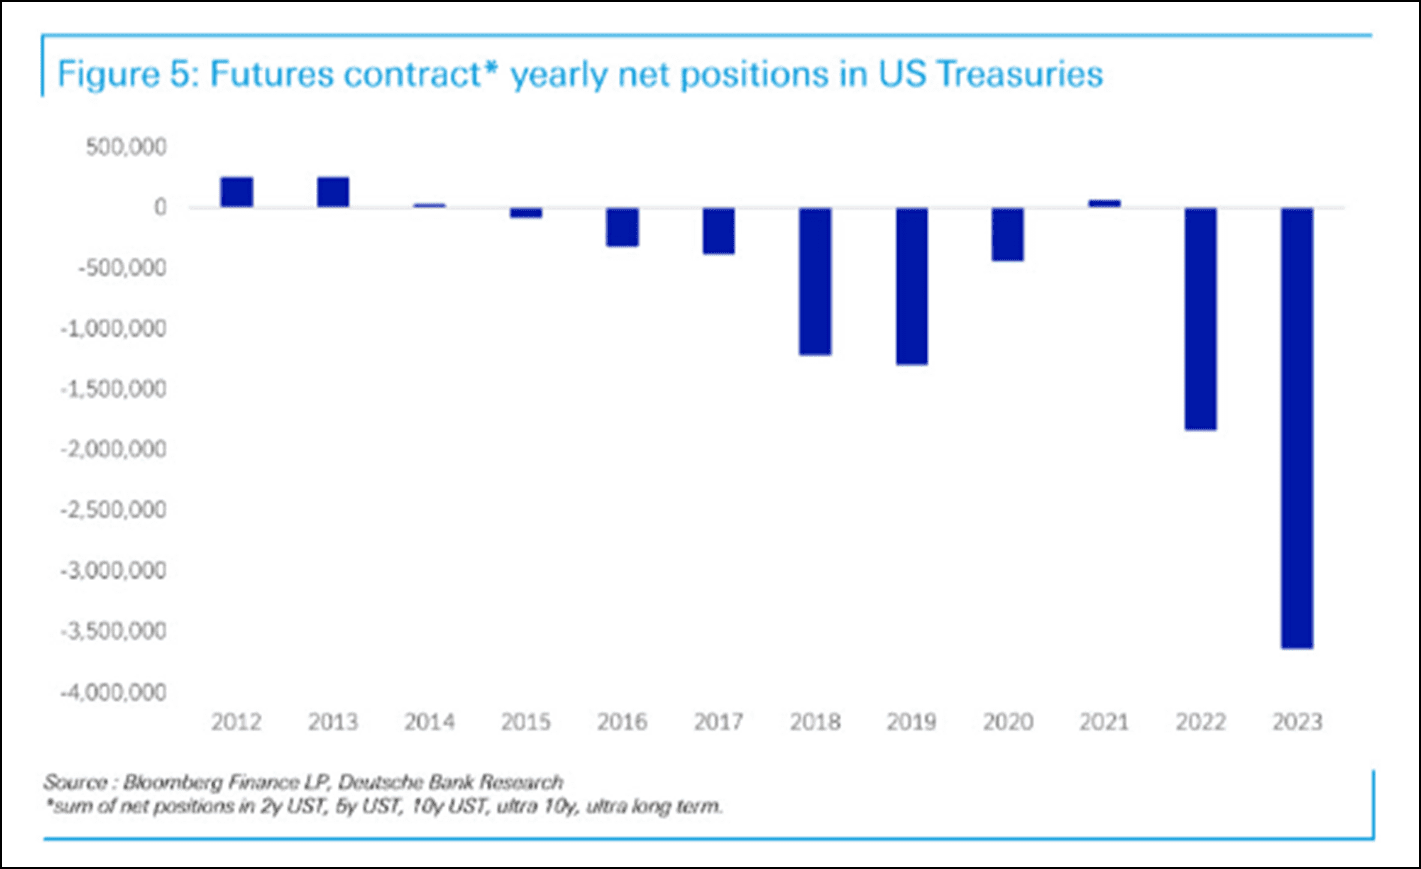
Speculators are massively short bonds, i.e., betting on higher rates:
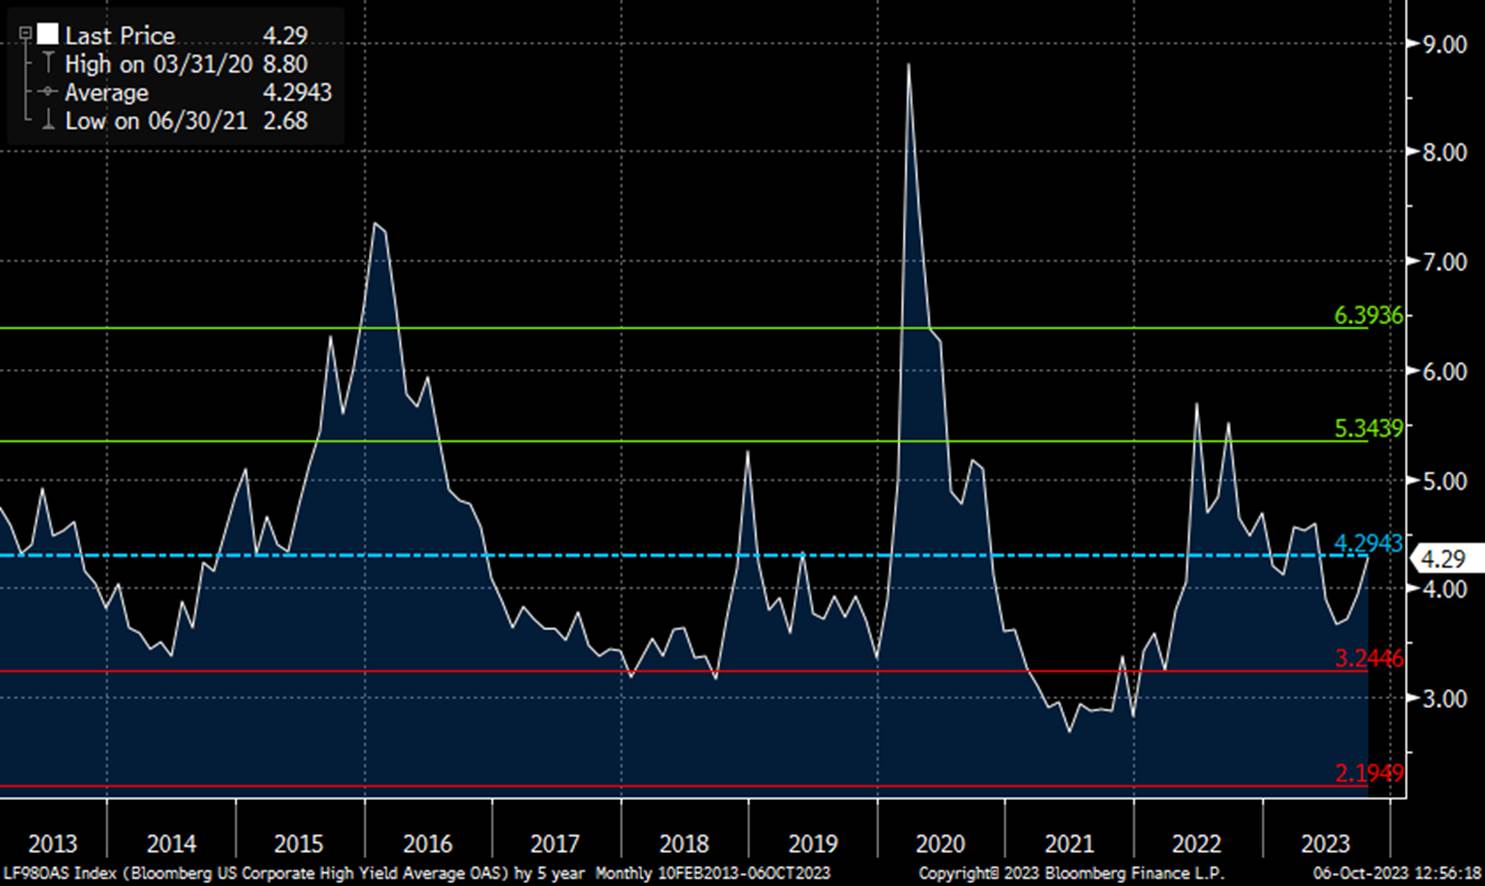
- Credit spreads – Negative but stable. A reminder we use this as a contrarian indicator. In other words, if we see spreads widening into the area above the green line, we may start to view risk/reward more favorably. High-yield spreads are exactly in-line with their long-term average:
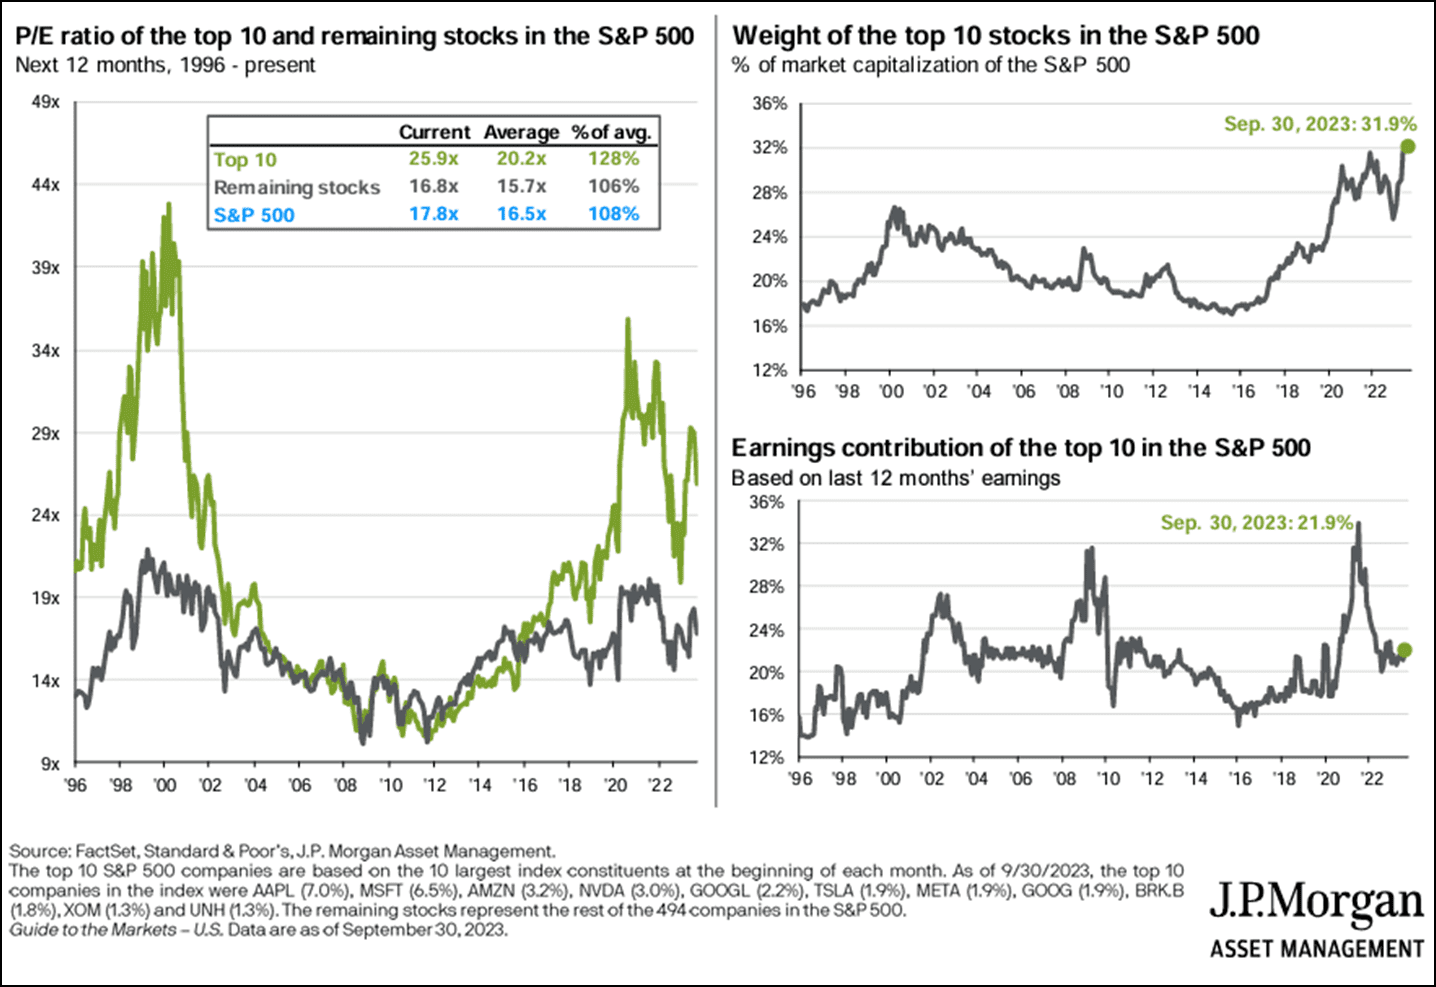
- Stock multiples – Negative but stable. We will state this again: large cap stocks are not cheap at the index level. The top ten stocks are even more overvalued, and the S&P 500 Index is as concentrated as it has even been.
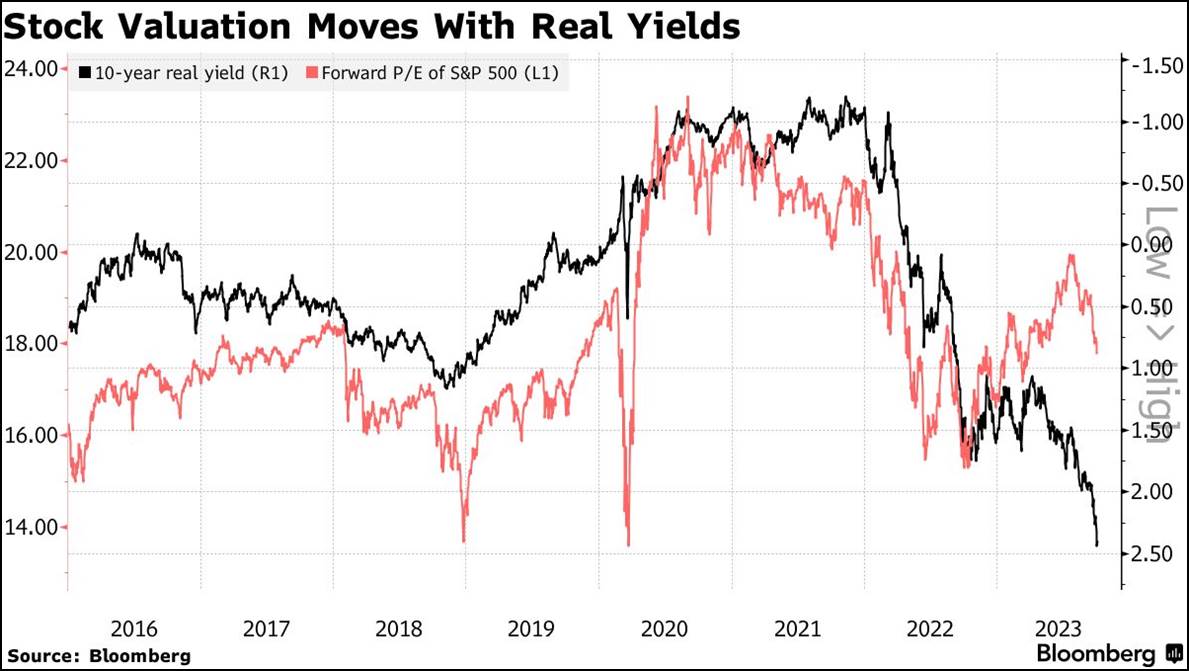
Stocks are historically expensive versus real, i.e., inflation-adjusted, yields. It is interesting to note the divergence starting around March of this year, as the S&P 500 became more expensive despite real yields moving significantly higher. These two began moving in the same direction again recently, and our concern is that equity valuations may catch down to yields.
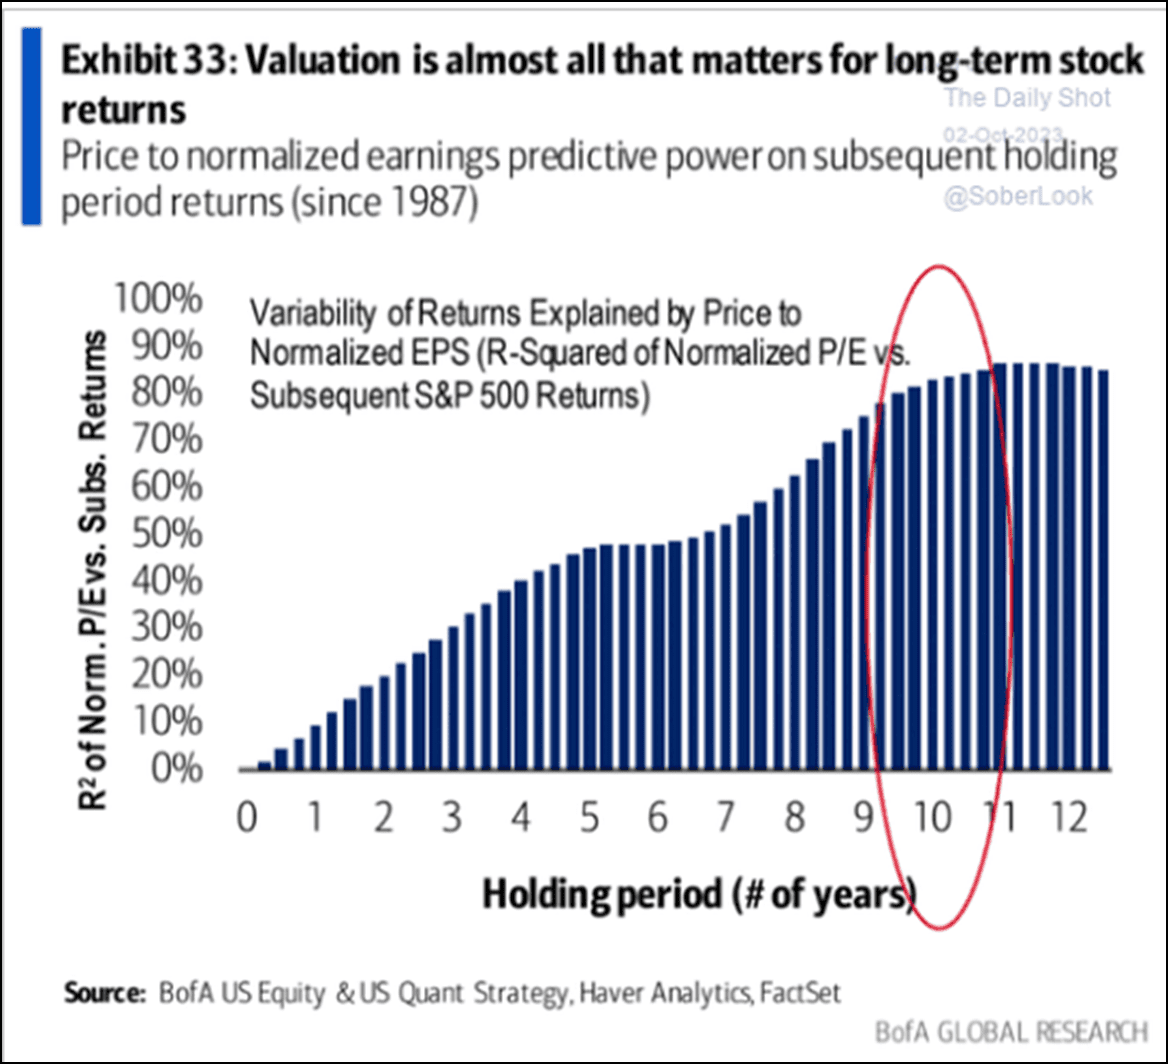
Over long periods of time, the deck is stacked in your favor by buying stocks at lower multiples. This is what our investment approach aims to do. We want time (and valuation) on our side.
If we look at the sector level, rate-sensitive sectors such as Utilities, Communications Services, and Real Estate are starting to become cheap, along with Energy. Most other sectors, especially Information Technology and Consumer Discretionary, remain expensive.
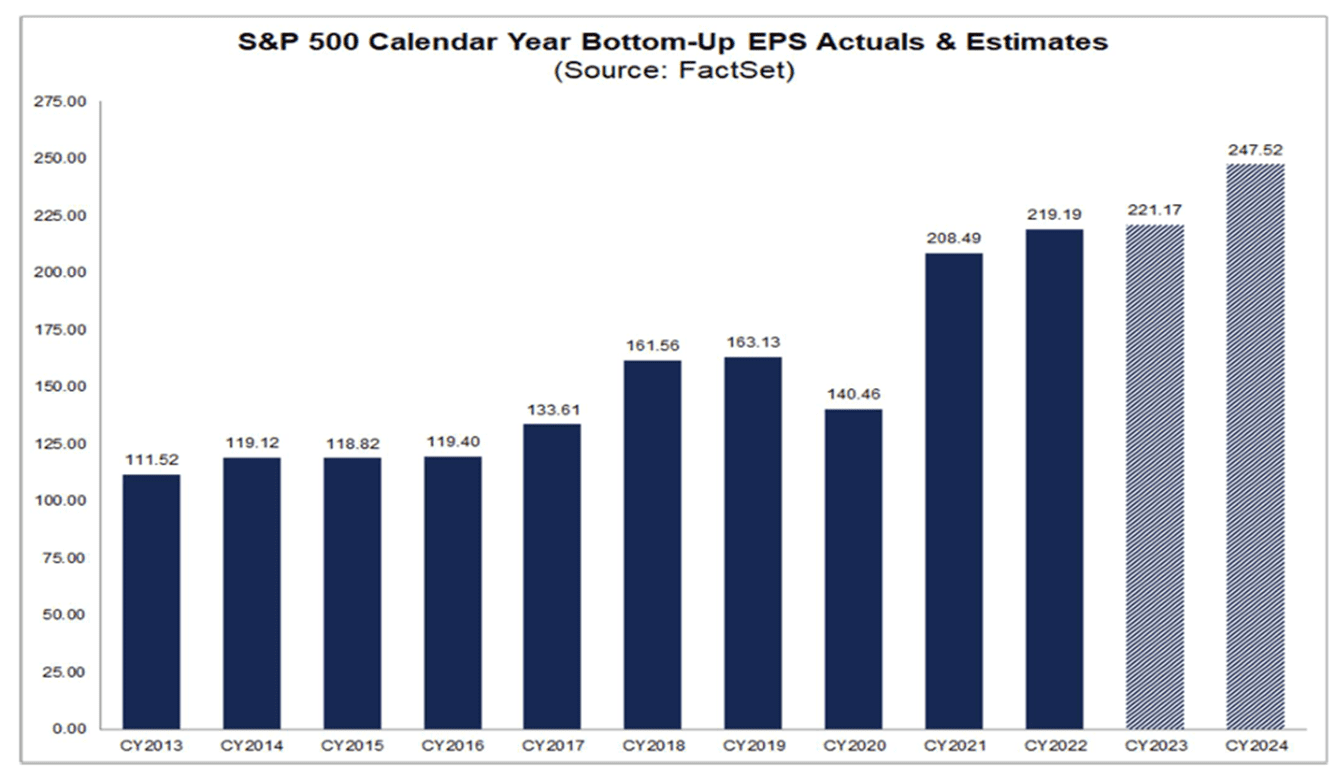
- Earnings growth – Negative but stable. Q3 earnings kick off next week, with FactSet estimates calling for a 0.3% decline year-over-year. At this point, the best guess is for flat EPS growth in 2023, followed by sizable (12%) growth in 2024. Given where margins are (only slightly below record levels) and the forces negatively impacting them (inflation, wages), that bar may be too high.
Conclusion – Love in Fairhope
As some readers know, we moved our family back to Cincinnati (Wyoming to be precise) in May. Our prior hometown, Fairhope, Alabama, has just been featured on a new “reality” show titled Love in Fairhope. I would say the show is objectively terrible, except for the fact that I do not want to be in hot water over an incendiary newsletter…again, so let us just say the show puts the quasi in quasi-reality.
For those who dare to watch, be assured that the protagonists are real and they’re spectacular. “Bad boy” Trevor is a local realtor, Abby’s mom is a bus driver at our children’s former school, Claiborne runs a consignment shop, and my wife did a fundraiser with Olivia. The other protagonists are actually from Daphne, which is the next town. Also, Fairhope has more than one bar, two stoplights, and a thousand people.
The point in sharing this backstory is that Abby, arguably the star of the show, moves back from New York to Fairhope. She immediately goes back to former beau Trevor, who shows up at the 50th Magnolia Ball (spoiler alert: the first forty-nine did not happen) with another woman. Abby ultimately marries her boyfriend from New York after various and sundry rodeos/ road trips/ dalliance with a fake Nashville singing sensation. The point is that Abby’s behaviors are not much different than those of investors (except for maybe the Nashville dalliance part). Investors return to what worked in the past, even if the warning signs are right in front of them.
We see it with the so-called Magnificent Seven. Investors loved these stocks in 2021. They hurt in 2022, but retail immediately returned to their overvalued embrace in 2023. The same thing holds true for bonds. Despite the pain, inflows into the “safety” of TLT ( the 20+ Year Treasury ETF) have been over $17 billion.
The warning signs for the Magnificent Seven are clear: valuation. We would categorize six of the seven as great businesses at what we might consider less than great valuations in some cases. The seventh keeps cutting the prices on its cars and introduced a $60k+ truck that looks like an updated Pontiac Aztec. Given higher discount rates, more highly valued stocks should suffer, but these clearly have not.

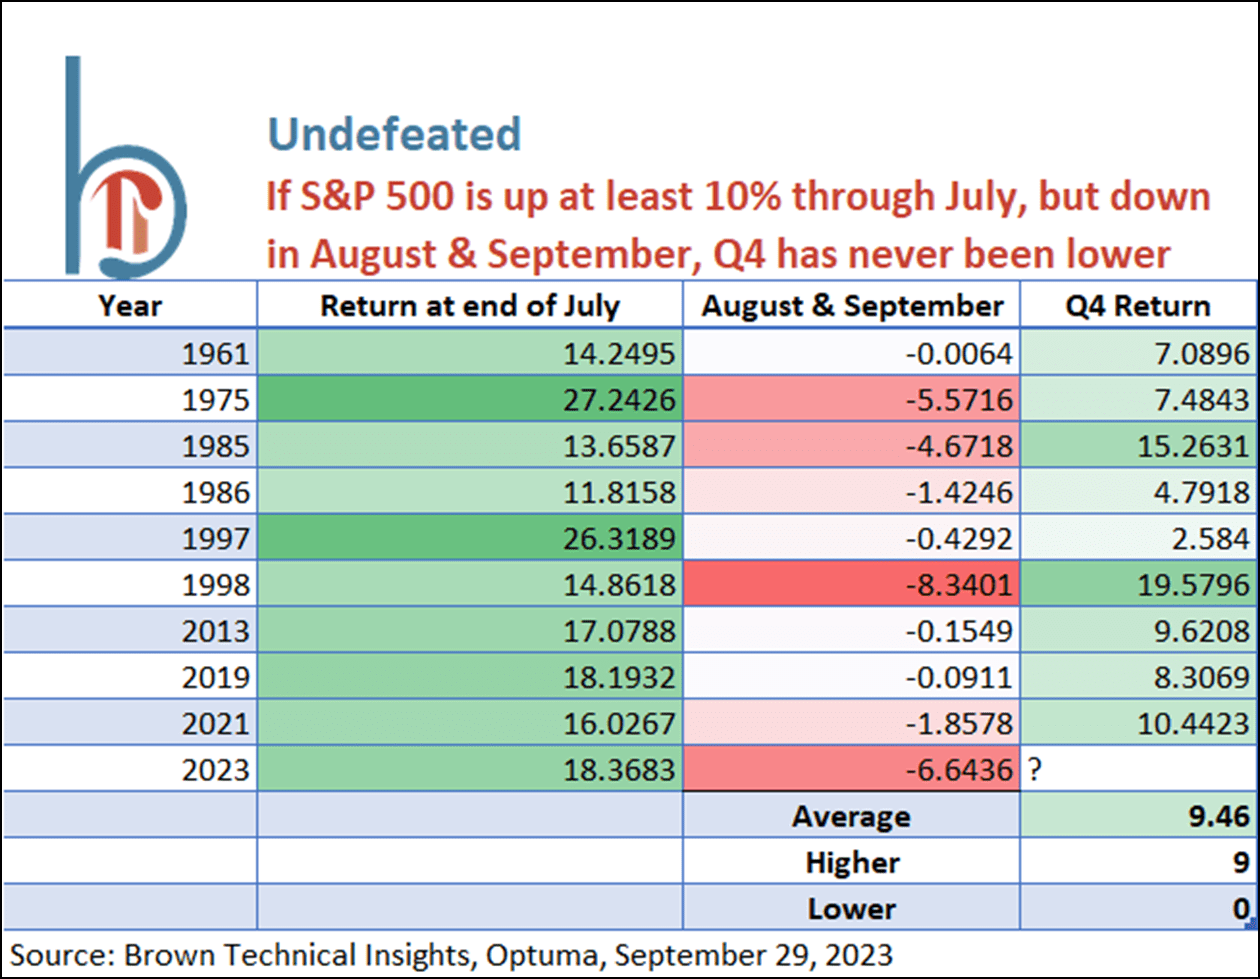
Aside from the loving embrace of the familiar, seasonality is also a friend to the market at this point. Permabulls are quick to cite stats like this, wherein September is normally weak and the latter part of the year continues the trend in good years. The same could be said of technically oversold conditions, which is accurate, given something like 80% or more of stocks trading below their 50-day moving average:
In a strange twist of fate, George Washington started the Seven Years’ War, an incident probably better known through its reference in Hamilton than anything else. Conditions were ripe for a global conflagration, and Washington, a representative of the British crown, being involved with the scalping of French officers, lit the fuse. Little did I know the book I just started reading (sometimes, you just need a break from dense history), Ubiquity, begins with the story of the assassination of Archduke Franz Ferdinand, and how that event triggered World War I. Unfortunately, both of these are potential analogs for the crisis unfolding in Israel/Gaza, where a horrific attack is now threatening to devolve into a more regional conflict.
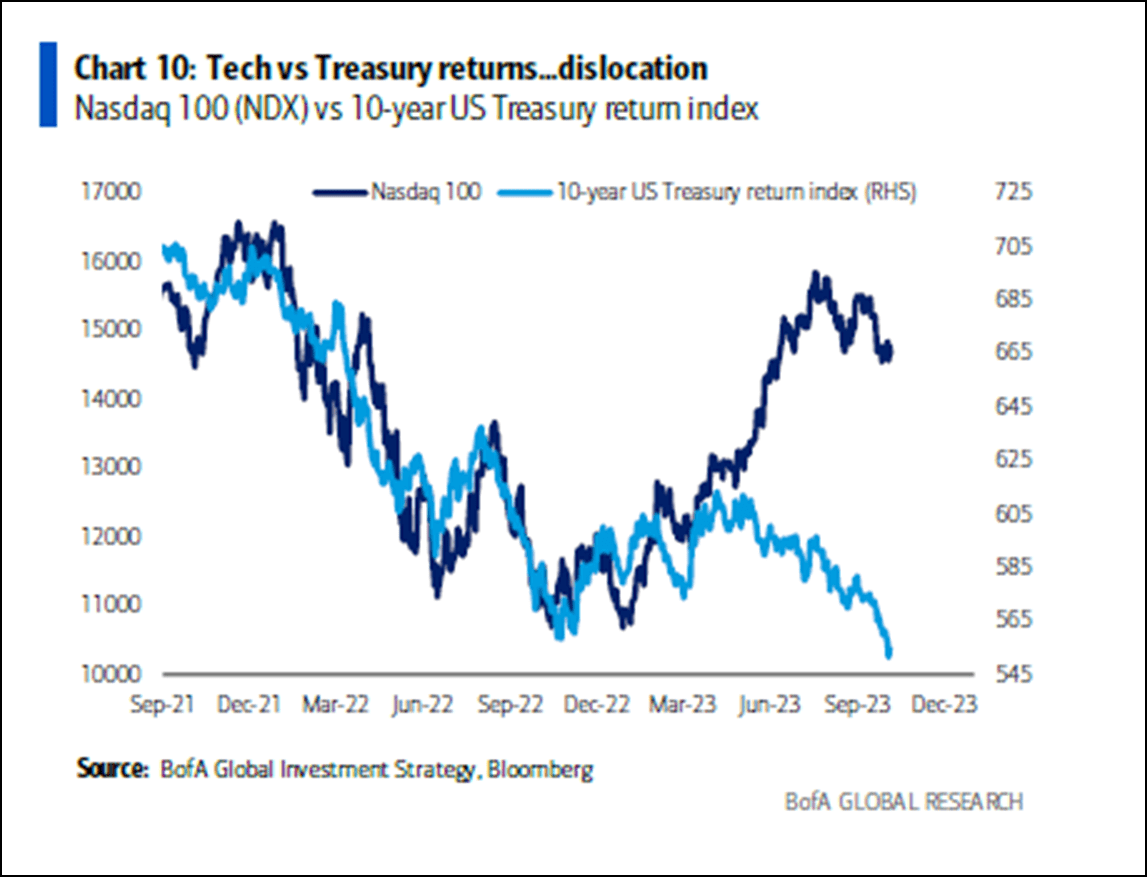
As Mark Buchanan states in the aforementioned book, “Beyond the labels “disaster” and “upheaval”, each of these events erupted from the soil of its own peculiar setting. Still, there is an intriguing similarity.” He goes on to state, “It is as if these systems had been poised on some knife-edge of instability, merely waiting to be “set off.” Be it geopolitical turmoil or markets, it sure seems like we are on an edge now. If you take away nothing else from this newsletter, it should be this. While we cannot know whether or not the conflict in Israel escalates, we can state, at least from a financial market perspective, that in recent history there has not been a time when a rise in bond yields of this magnitude has failed to cause a calamity:

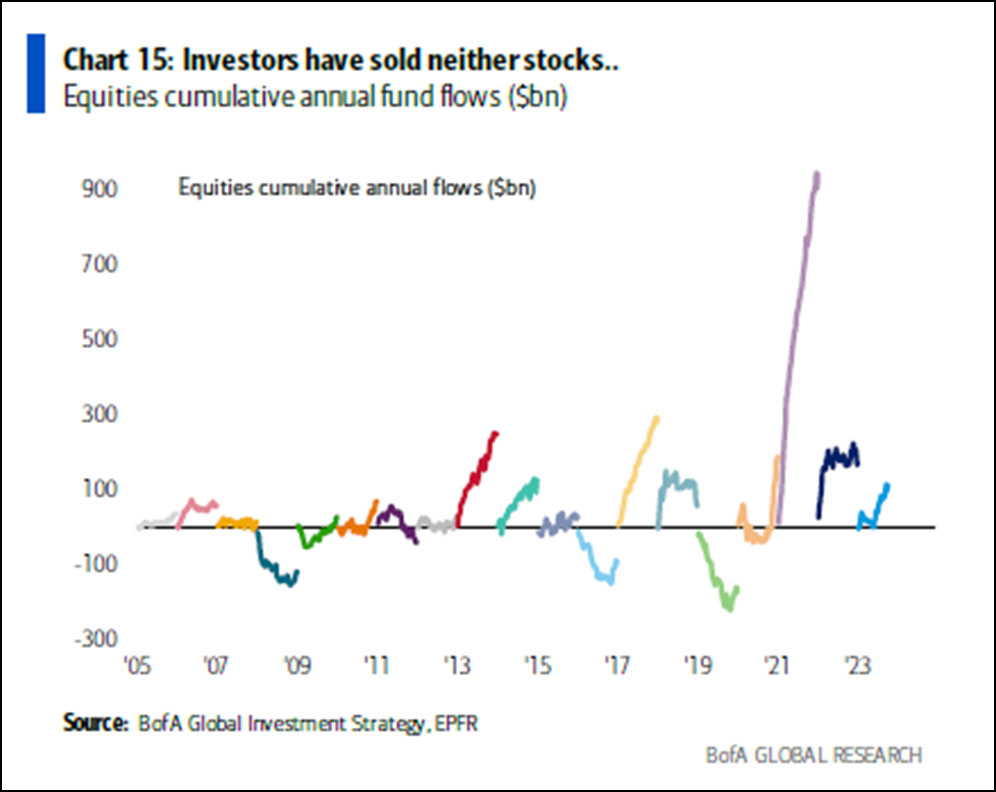
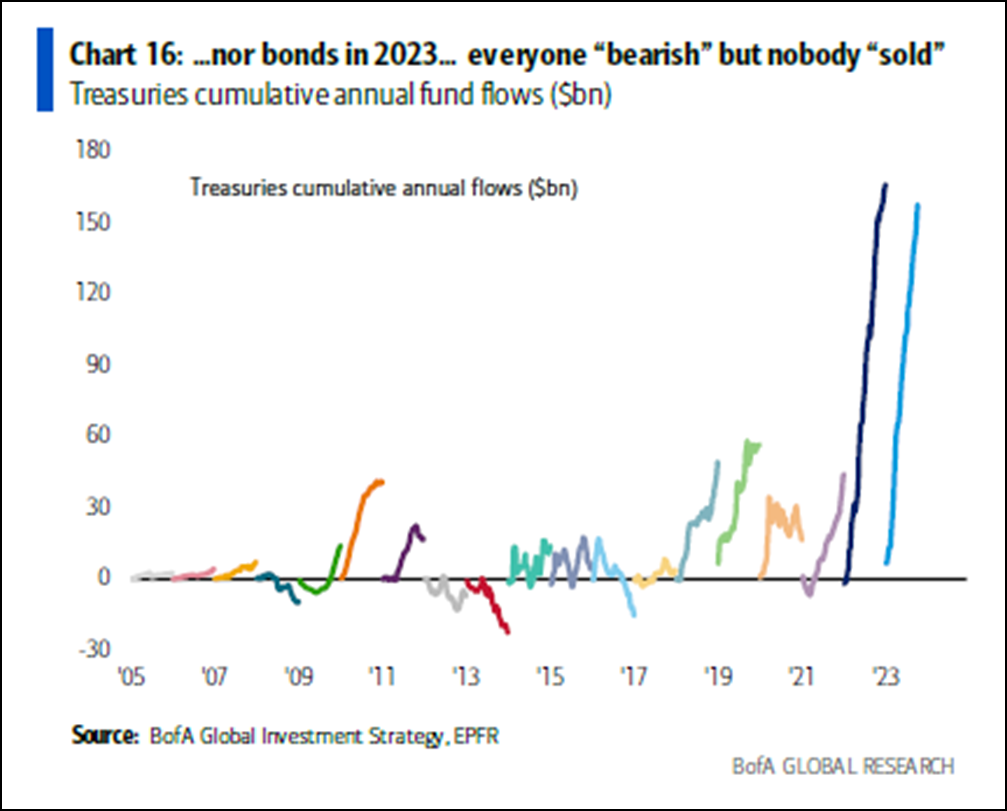
The quasi-reality narrative is that investors are scared and have fled out of risk assets; the actual reality story is they have piled into both equity and debt:
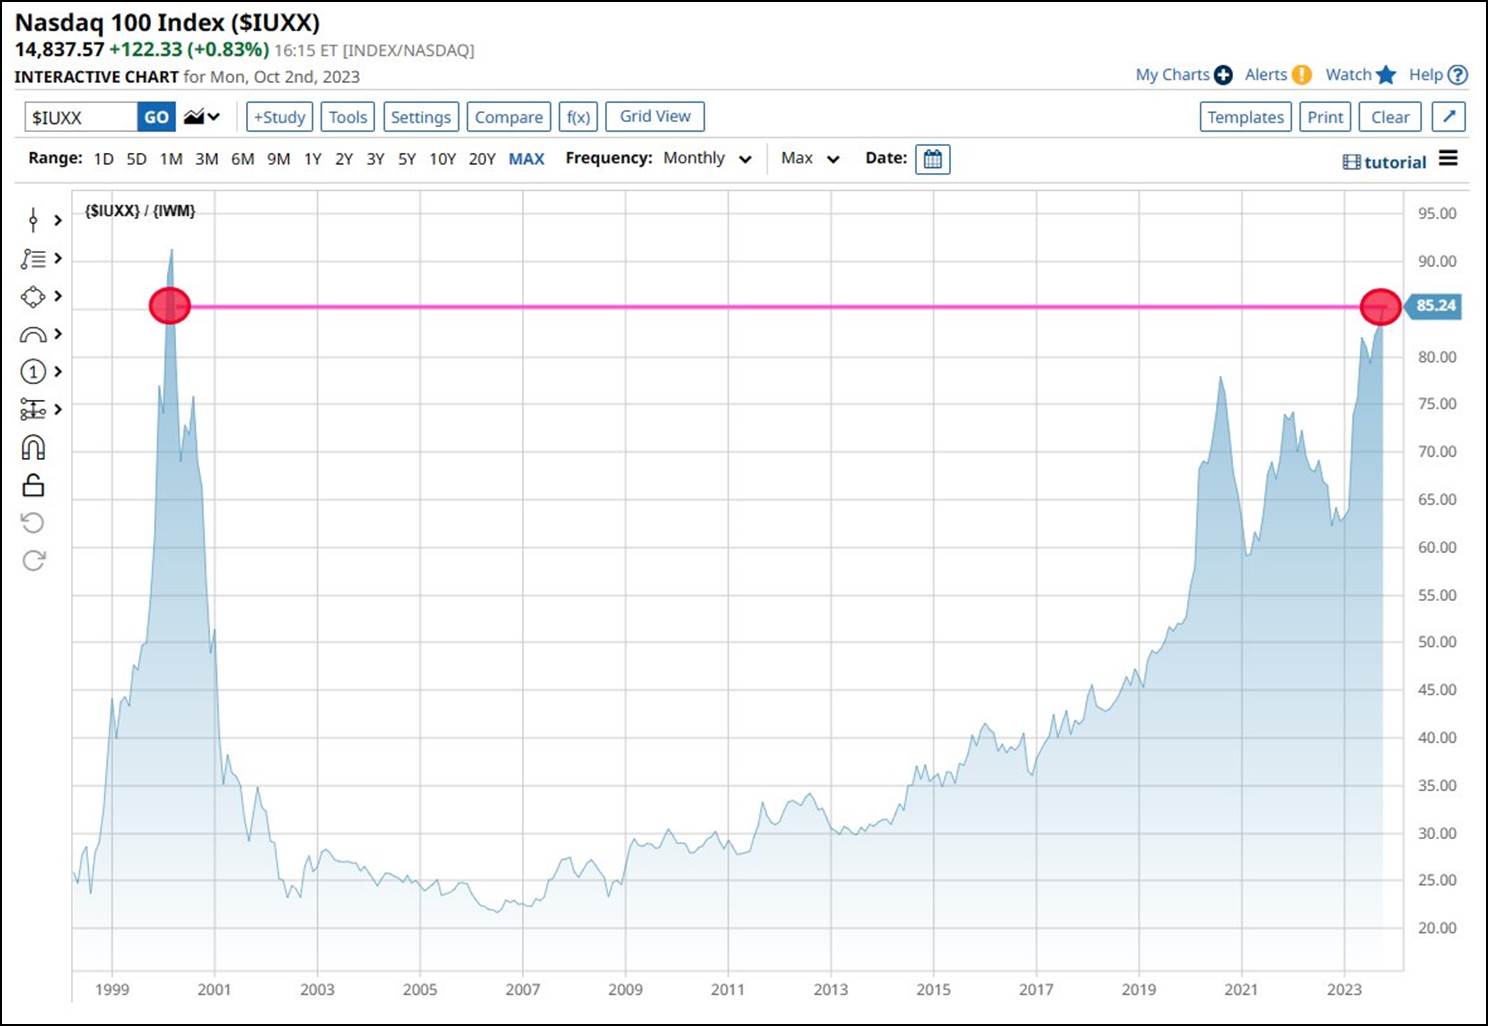
Whether it is the unexpected attack on Israel by Hamas, a more known risk (commercial real estate affecting already weak bank balance sheets, surging interest rates, weakening consumers), or a Rumsfeldian “unknown unknown”, any grain of sand has the potential to topple the highly valued magnificent seven. Using the NASDAQ as a proxy, we see valuations versus small caps at tech bubble levels:
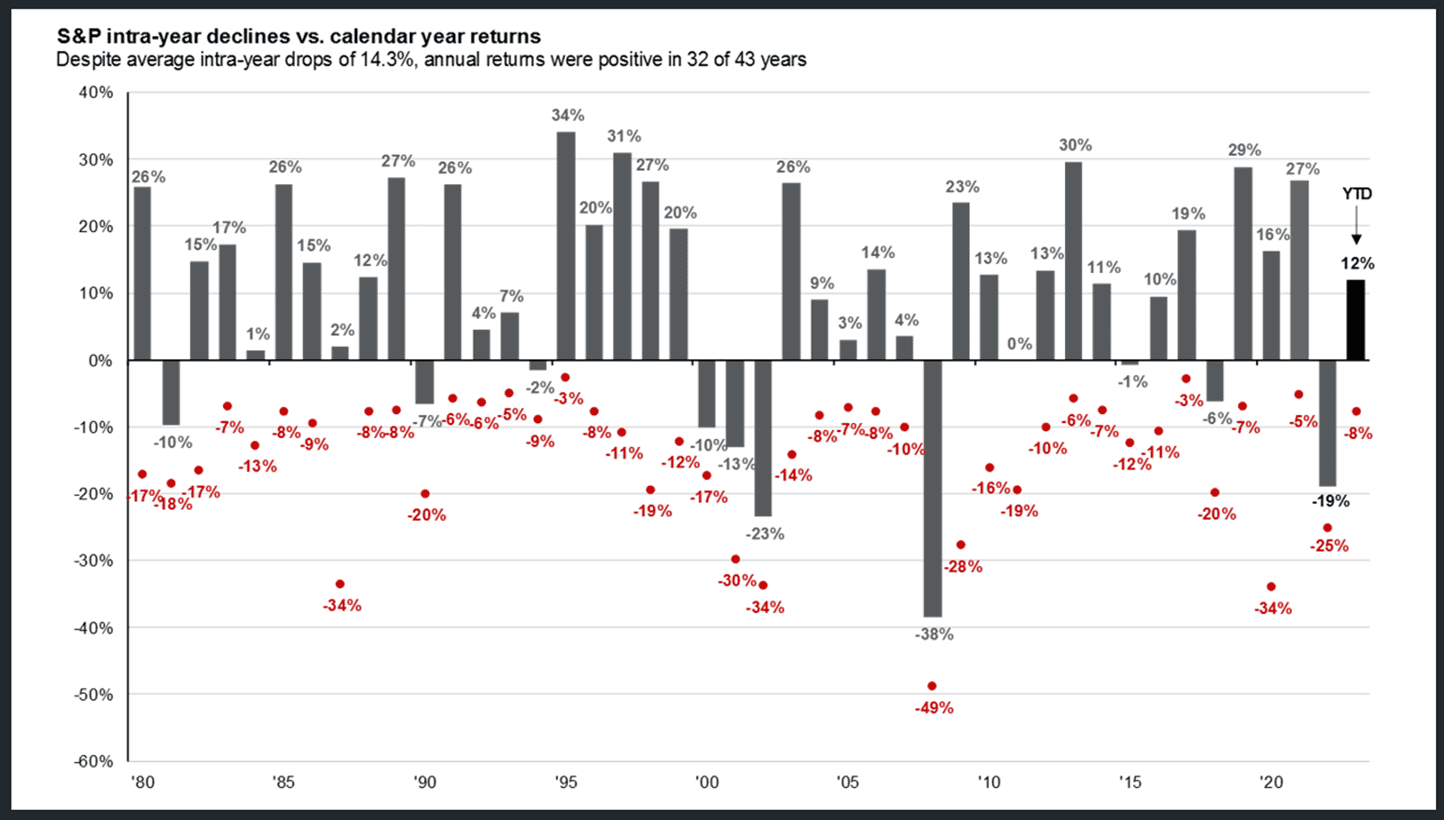
Investing is a reality show we live every day. Unlike Love in Fairhope, this one is not scripted, and narrator Heather Graham is not here to explain what everything means. We are left to help our investors navigate what, despite being a scary environment in terms of the market as well as geopolitics, has been a less than scary year versus average, at least so far; the 8% drawdown for the S&P 500 year-to-date is about half of the average 14% decline that the market experiences in a given year.
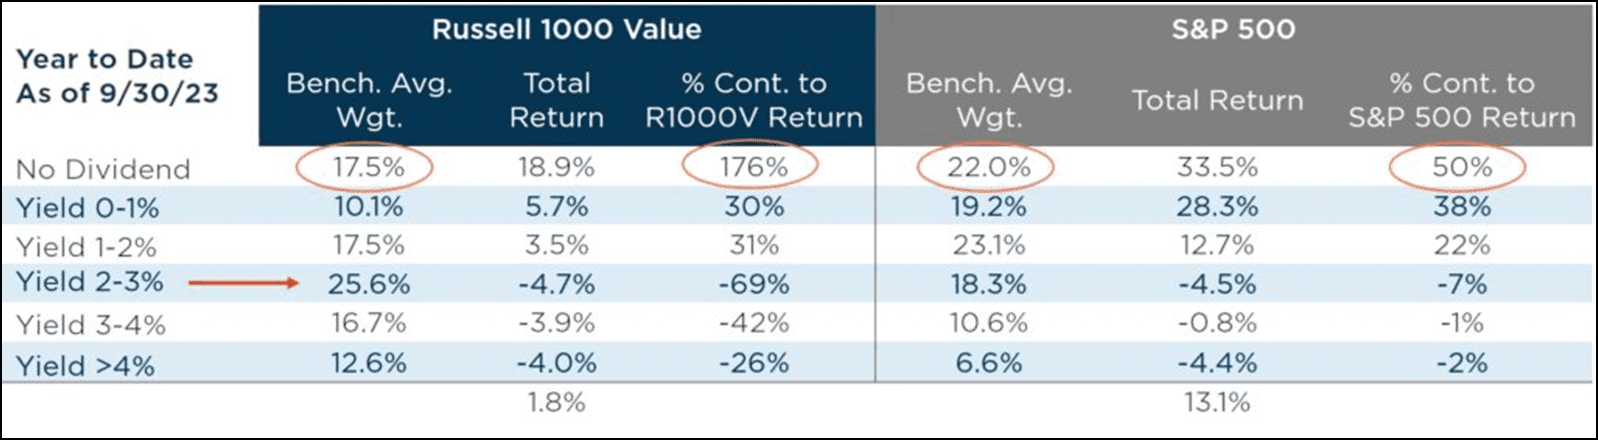
One reason this year has felt worse for investors is because the average stock has done far worse than the index. Herein lies the opportunity for us, as active investors, to find stocks where the risk/reward looks attractive. To outperform, you have to think (and act) differently, and against a backdrop where flows into ETFs (passive, predominantly) and out of long only (LO, which are generally active mutual funds), we are finding opportunities in those areas of the market that have been underperforming this year, especially companies with higher dividends.
Get Formidable News Direct to Your Inbox!
"*" indicates required fields
Check out our podcast Tea & Crumpets. Available on Apple Podcasts and Spotify.