

Adam Eagleston, CFA
CIO

Will Brown
CEO/Managing Partner
October 2025 Update: Oedipus Rex (or Wrecks)
Part I – Summary
October 2025 Update: Oedipus Rex (or Wrecks)
Though technically not the actual title (Oedipus was a tyrant (tyrannus), not a king (rex)), we can never pass over a good pun. Accordingly, we comically (or, maybe satirically) use a play on words here as our theme.
Key Takeaways:
- Tragedy
- The tragedy of April’s swoon forgotten, returns for stocks have made investors giddy this year.
- However, just as we saw in Q2, big winners remain a handful of technology stocks and speculative retail favorites. Quality and value stocks are trending toward a third consecutive year of underperformance.
- Circular deals reminiscent of the late 1990s have us questioning the actual economics underlying many AI investments.
- Comedy
- Despite record highs for stocks, lower income cohorts continue to struggle with higher living costs and stagnant wages, which are no laughing matter.
- Additionally, labor markets are showing signs of weakness even as stock valuations are reaching stratospheric levels, both of which the Fed has acknowledged.
- Accordingly, the Fed seems committed to further rate cuts despite inflation running hotter than it may like.
- Satire
- Historically, the strong momentum we have seen in stocks continues.
- With the government shut down, we will have limited visibility into inflation and job market data.
- After receding into the background, the threat of tariffs made an unwelcome (and unexpected) return in early October, threatening to wreck a sustained recovery.
For those who prefer not to read further, before you close the email, please know these three things.
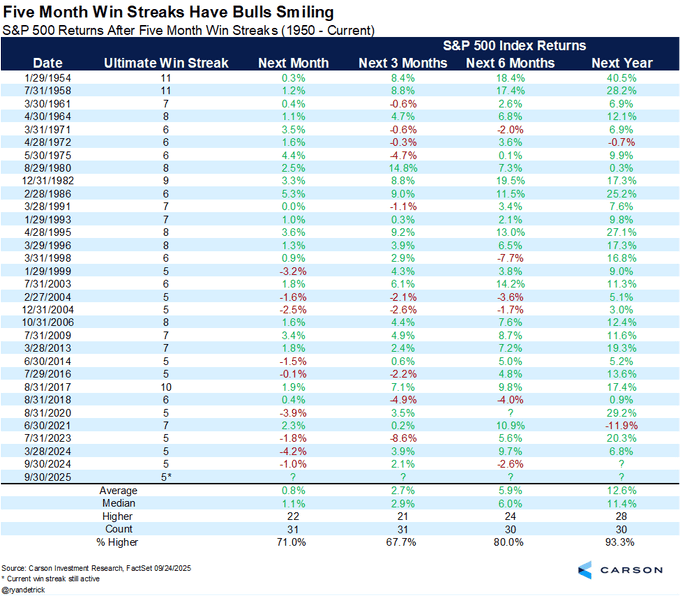
- After five consecutive months of gains, momentum tends to propel the market higher.
- A narrow market with fewer than one in five stocks outperforming has put us on a path toward a third consecutive year of challenging conditions for active managers.
- The Federal Reserve is more concerned about the labor market (versus inflation), and markets are pricing additional rate cuts in Q4, which is helping keep both valuations and earnings expectations extremely elevated, not to mention buying more speculative parts of the market.
Data as of October 10, 2025; Source: Bloomberg, Goldman Sachs
Part II: Q3 2025 Recap –Tragedy
It is tough to use “tragedy” as the lead-in for a market review in which the S&P 500 gained 8% and hit a new all-time high but go with us. The reason is Oedipus. For those unfamiliar, here is a summary from AI tool Perplexity, “Oedipus is a Greek tragedy about King Oedipus, who unknowingly fulfills a prophecy that he will kill his father and marry his mother. After solving the Sphinx’s riddle, Oedipus becomes king of Thebes but later must find the murderer of the former king to stop a plague. The truth emerges that Oedipus himself is the killer, leading to his (mother’s) wife’s suicide and his self-blinding and exile as punishment for the tragic fate he could not escape.”
You may still be asking, why Oedipus? Well, if you look at the nature of the transactions taking place in the AI space, incestuous is the best word to describe it. Mackenzie Pulte, one of our Junior Portfolio Managers, put the following insightful analysis together:
It is no secret that there is an arms race on the Artificial Intelligence front. Companies are pouring billions into hardware, software, infrastructure, energy, and implementation processes, with almost $1 trillion already invested globally across industries. The growing demand for computing power and infrastructure has driven massive capital expenditures, sparking partnerships, technical monopolies, and a wave of circular investments.
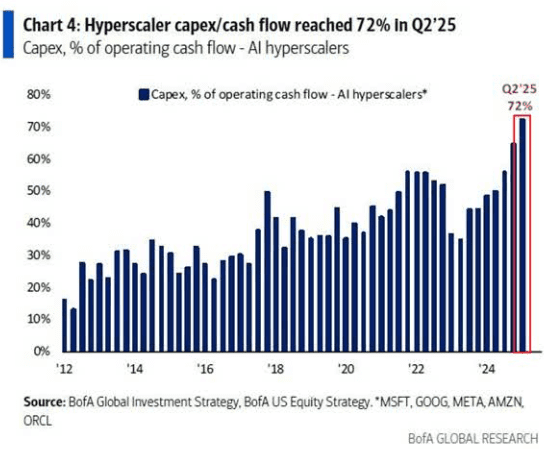
A prime example of these circular investments is OpenAI, a leading artificial general intelligence company at the center of the AI frenzy. Backed by some of the biggest names in the tech space, including Microsoft, Nvidia, Oracle, and AMD, OpenAI has recently struck a string of headline-making deals. Just recently, OpenAI announced a $100B agreement with AMD to purchase 6 gigawatts of computing power. As part of the deal, AMD issued warrants for up to 160 million shares of its stock, contingent on deployment milestones. The announcement sent AMD shares up nearly 30% in a single trading day, helping the company gain a competitive edge in the tech race.
Just a month before, OpenAI had announced Nvidia’s $100B investment, paired with an agreement that OpenAI would purchase over 10 gigawatts of computing power from Nvidia. Around the same time, OpenAI, Oracle, and SoftBank unveiled the Stargate Project, which consists of five new data centers that boosted planned capacity to nearly 7 gigawatts of the 10-gigawatt goal. The charts below illustrate how interconnected and mutually reinforcing these AI investments have become.
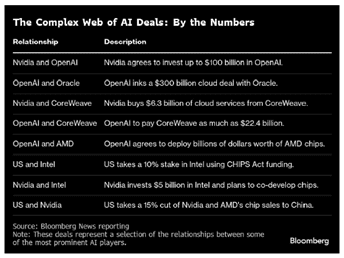
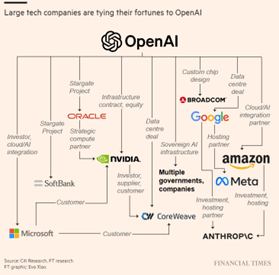
For shareholders, the risks are tangible. Deals like the OpenAI–AMD partnership could leave OpenAI with as much as a 10% stake in AMD, potentially diluting existing holdings and weakening shareholder value. While these announcements can create short-term stock rallies, the long-term benefits for investors remain uncertain.
Ultimately, OpenAI serves as just one example in the increasingly “incestuous” relationships shaping the tech industry. Competitors, suppliers, and customers are often one and the same, blurring the lines between collaboration and competition. This web of alliances raises critical questions: are these partnerships building sustainable value, or are they simply fueling an overheated AI arms race that may not hold up under financial scrutiny and economic pressure?
My summary: the Open AI family tree looks like it belongs to Oedipus or Cletus Spuckler. This seems a lot like the vendor financing deals we saw during the late 1990s; per a CNN article: “intertwined setups, including some known as “vendor financing,” are common in the frothy world of artificial intelligence. But the many layers of overlap, concentrated among the companies whose stocks have been propping up the US stock market, have made it hard to disentangle how much demand for AI is authentic hunger from customers and investors and how much of it is just capital being recycled to keep up the appearance of progress.
Vendor financing — along with the doubling, tripling or quadrupling of companies’ valuations — is one of the unflattering echoes some analysts see in comparing today’s AI frenzy with the late-90s dot-com bubble. Back then, telecom equipment giants like Cisco, Nortel and Lucent borrowed heavily to offer their customers financing deals that essentially ensured sustained demand for telecom equipment.”
Now that we have the unpleasant comparisons out of the way, let’s look at returns for this year, which have been anything but tragic.
| Fund/Index | 1-Month | 3-Month | YTD | 1-Year |
|---|---|---|---|---|
| S&P 500 INDEX | 3.64 | 8.11 | 14.81 | 17.56 |
| Invesco S&P 500 Equal Weight E | 1.01 | 4.83 | 9.68 | 7.66 |
| Russell 2000 Index | 3.11 | 12.39 | 10.38 | 10.74 |
| NASDAQ Composite Index | 5.68 | 11.43 | 17.96 | 25.47 |
| MSCI EAFE Index | 1.96 | 4.87 | 25.83 | 15.69 |
| MSCI Emerging Markets Index | 7.17 | 10.92 | 28.17 | 18.12 |
| Bloomberg US Treasury Total Re | 0.85 | 1.51 | 5.36 | 2.06 |
| Bloomberg US Agg Total Return | 1.09 | 2.03 | 6.13 | 2.88 |
| Invesco DB Commodity Index Tra | 1.44 | 3.30 | 5.38 | 6.56 |
Source: Bloomberg (as of most recent month end)
| Fund/Index | 1-Month | 3-Month | YTD | 1-Year |
|---|---|---|---|---|
| Vanguard Russell 1000 Growth E | 5.21 | 10.48 | 17.10 | 25.49 |
| Vanguard Russell 1000 Value | 1.45 | 5.36 | 11.54 | 9.34 |
| Vanguard Mid-Cap Growth ETF | 1.76 | 3.46 | 16.34 | 21.48 |
| Vanguard Mid-Cap Value ETF | 1.54 | 6.69 | 9.74 | 6.53 |
| Vanguard Russell 2000 Growth | 4.15 | 12.26 | 11.70 | 13.48 |
| Vanguard Russell 2000 Value | 2.26 | 12.75 | 9.30 | 8.02 |
Source: Bloomberg (as of most recent month end)
Over the last 12 months, only 17% of the stocks in the S&P 500 have outperformed the index.
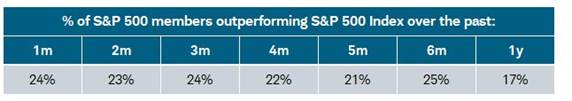
Source: Charles Schwab, Bloomberg (as of October 6, 2025)
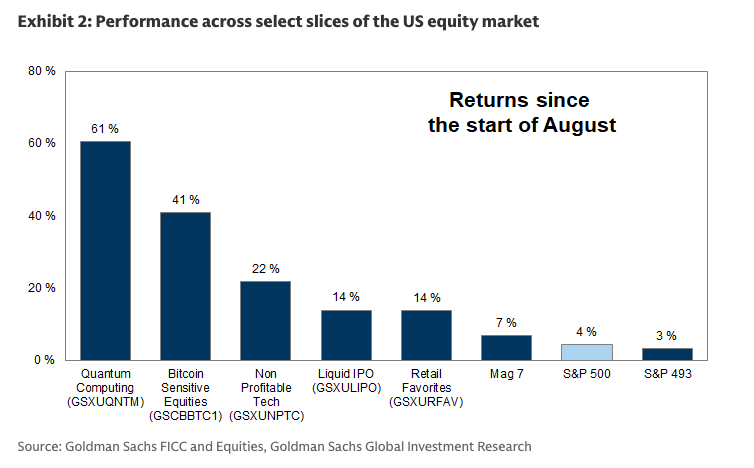
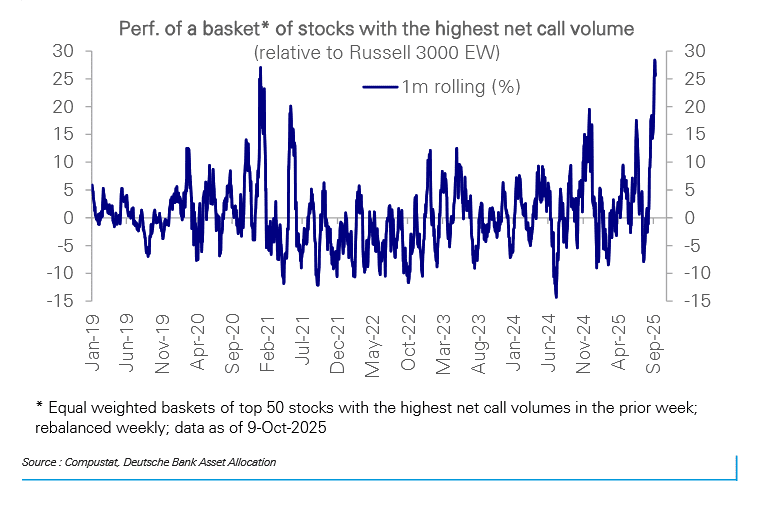
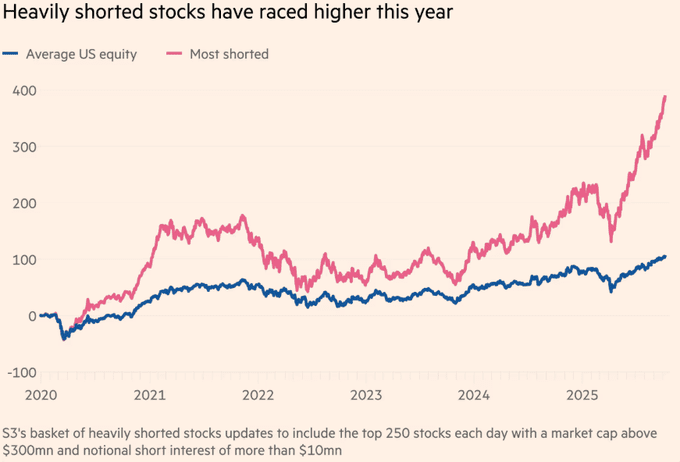
Making the job of active managers like us even more challenging is a look at what has won. While it makes sense that the so-called Magnificent Seven have outperformed against the backdrop of the aforementioned AI mania, their year-to-date gain pales in comparison to the performance of unprofitable tech companies (+53%), retail favorites (+45%), and the most shorted stocks (+38%). This triumvirate is the epicenter of speculation (perhaps gambling is the better term), and shows the amount of froth present in the market at present.
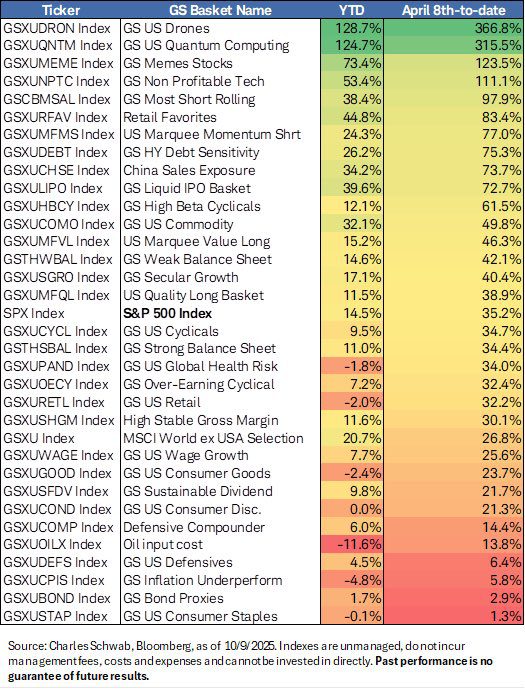
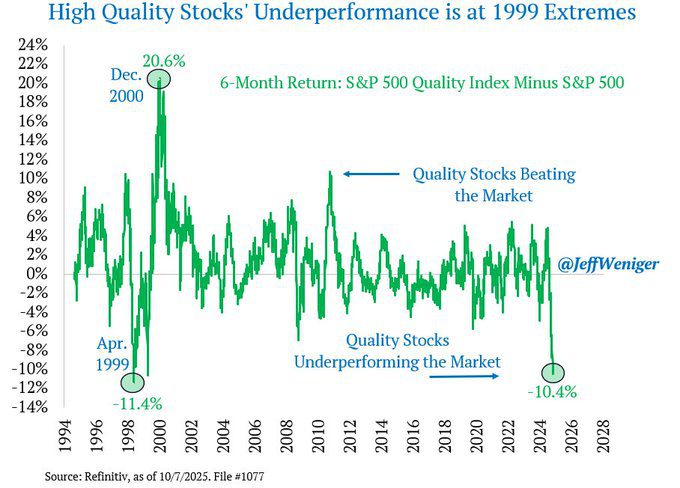
On the other hand, we have seen the worst environment for high quality stocks since 1999.
Q4 and 2025 Outlook – Comedy
In keeping with our AI theme, we use Google’s AI overview of ancient Greek comedy, which states a typical old Greek comedy contains, “an introduction that presents a “happy idea” or fantasy, followed by a debate between opposing characters.” This is an outstanding way to provide our outlook.
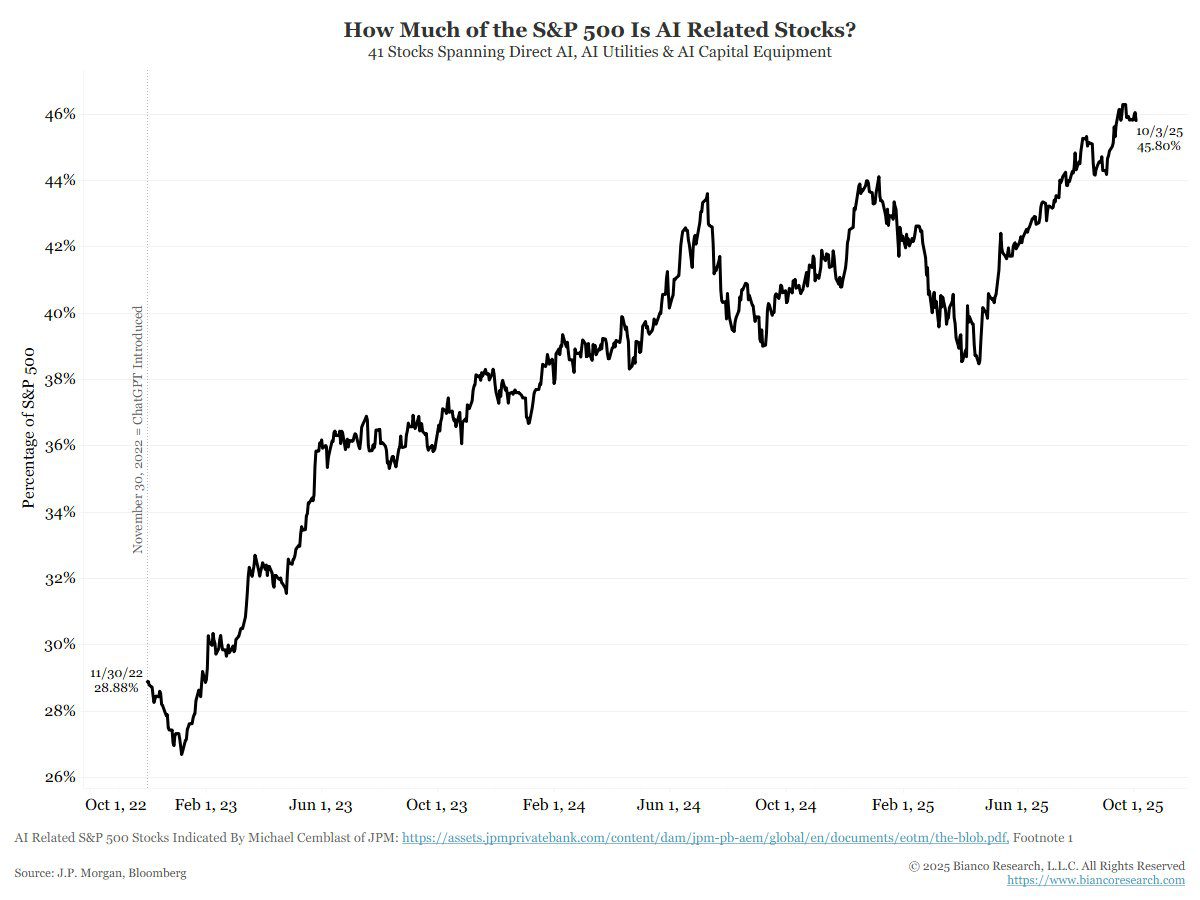
What is the happy idea? It is that the massive enthusiasm for artificial intelligence (AI) investment will lead to a productivity demand the likes of which has never been seen, propelling these AI stocks even higher, although AI stocks are already approaching half of the S&P 500 by weight.
The debate? Can the incredible enthusiasm around AI continue to drive both the economy and the stock market? Per the Financial Times:
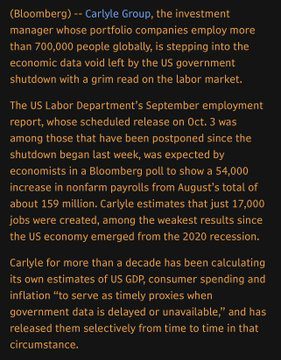
Taking the other side of the debate is the labor market. With the government shut down, the private sector has stepped into the void, with Carlyle’s stats showing the weakest job growth since the pandemic in September.
The Fed has acknowledged this weakness; here are a few quotes from Chair Powell in late September.
- “Recent data show that the pace of economic growth has moderated. The unemployment rate is low but has edged up. Job gains have slowed, and the downside risks to employment have risen.”
- “At the same time, inflation has risen recently and remains somewhat elevated. In recent months, it has become clear that the balance of risks has shifted, prompting us to move our policy stance closer to neutral at our meeting last week.”
- “The recent pace of job creation appears to be running below the “breakeven” rate needed to hold the unemployment rate constant.”
- “The increased downside risks to employment have shifted the balance of risks to achieving our goals. We therefore judged it appropriate at our last meeting to take another step toward a more neutral policy stance, lowering the target range for the federal funds rate by 25 basis points to 4 to 4-1/4 percent. This policy stance, which I see as still modestly restrictive, leaves us well positioned to respond to potential economic developments.”
In addition to opining on the labor markets, Powell had this to say about the stock market, “by many measures, for example, equity prices are fairly highly valued.” While many were quick to point to the analog of Alan Greenspan’s “irrational exuberance” comment during the tech bubble, it is important to note Greenspan made that comment in December of 1996; the tech bubble peaked in March 2000 at more than double its level from when Greenspan made his comments. In other words, to paraphrase a well-known adage, beware of Fed chairs bearing valuation advice.
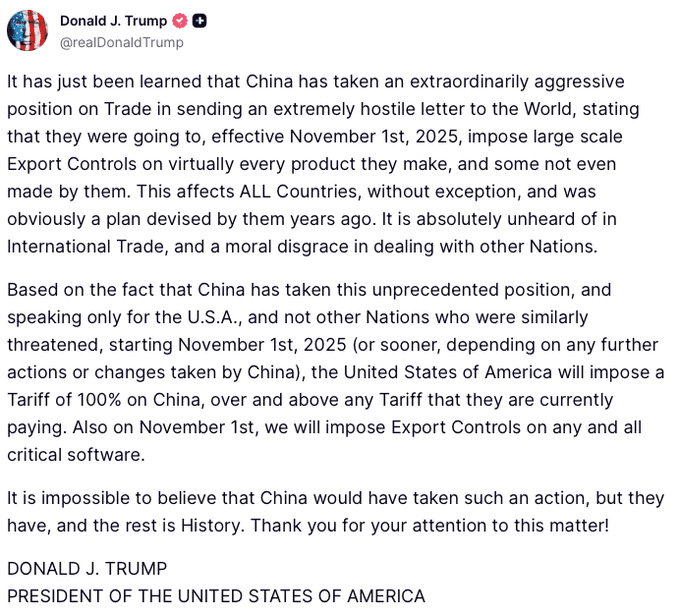
As we write this outlook, economic tensions with China have moved to the front page of Twitter, though whether this is posturing or something more ominous remains to be seen. It was enough to send the S&P 500 to its worst day since April and for bitcoin to suffer its largest ever one-day decline. From Forbes, “$19 billion in liquidations in the past 24 hours … worse than Covid and worse than [the] FTX”-led market meltdown.”
From October 10:
However, on October 12, the perception of a softer stance on China buoyed markets.
In terms of the actual statistical factors we track (versus tweets and vibes), three improved into the neutral category (GDP growth, earnings growth, and Fed Policy) while valuations deteriorated. For more details on all of our factors, click here.
| More Negative | Neutral | More Positive | |
|---|---|---|---|
| Inflation | ≈ | ||
| GDP Growth | → | ||
| Fed Policy | → | ||
| Interest Rates | ≈ | ||
| Credit Spreads | ≈ | ||
| Stock Multiples | ← | ||
| Earnings Growth | → | ||
| Deteriorating | ← | ||
| Stable | ≈ | ||
| Improving | → | ||
Conclusion – Satire
Given the absurdity of actual headlines and the prevalence of social media, some argue that satire is dead.
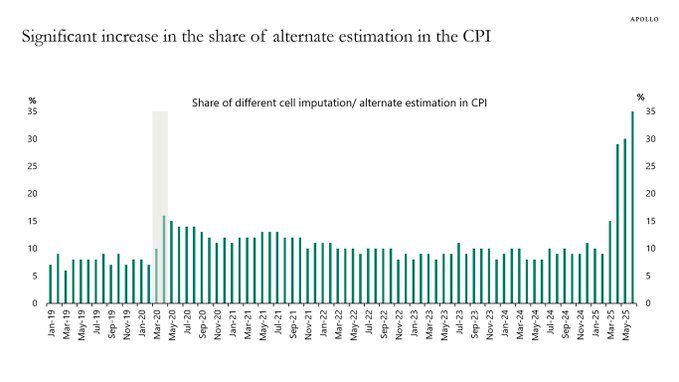
We can see why. For example, a headline reading, “Government to fight inflation by making up numbers” might have seemed like something from The Onion, but data from Apollo (not the Greek god, the investment firm) shows that around 35% of data that feeds into the inflation calculation is estimated, up from around 10%. Maybe this is why the Fed is no longer concerned with its 2% target…
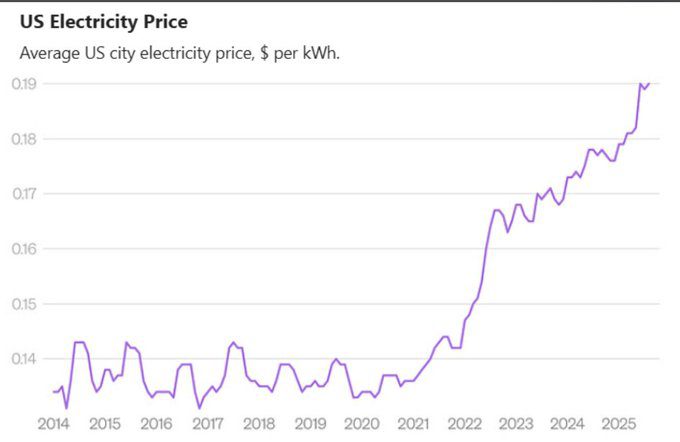
Or, how about “Americans choose to burn wood for heat so they can watch memes of Sponge Bob at Walmart”.
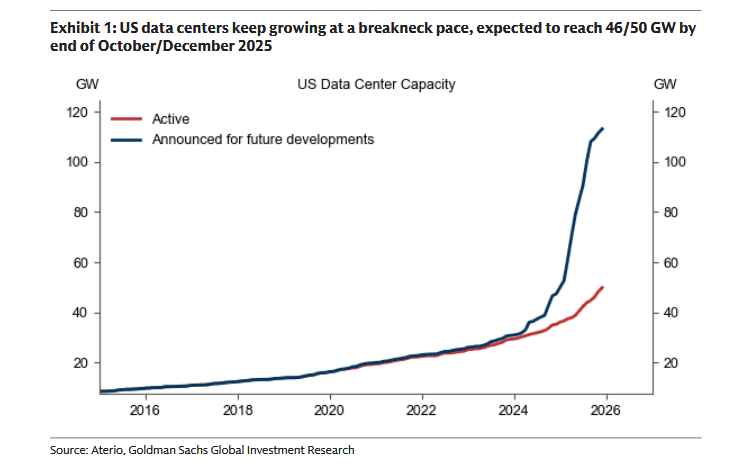
With electricity prices soaring and data center usage expected to grow substantially, this is the (hyperbolic) choice we face. For context, according to CNBC, “a data center campus with peak demand of one gigawatt is roughly equivalent to the average annual consumption of about 700,000 homes, or a city of around 1.8 million people, according to a CNBC analysis using data from the Department of Energy and Census Bureau.” From where we are now, we need an additional 70 gigawatts of power for just those data centers that have been announced. How are we going to manage that type of power demand?
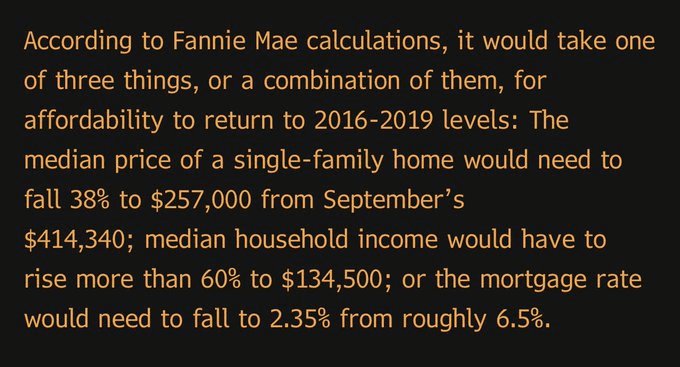
Or, how about a headline reading “Americans need a housing crash to afford houses.” That is effectively what the math is; hyperinflation would also work…
Enough about satire for now. Oedipus attained his role as tyrannus by answering the riddle of the Sphinx, which was “which is the creature that has one voice, but has four feet in the morning, two feet in the afternoon, and three feet at night?”
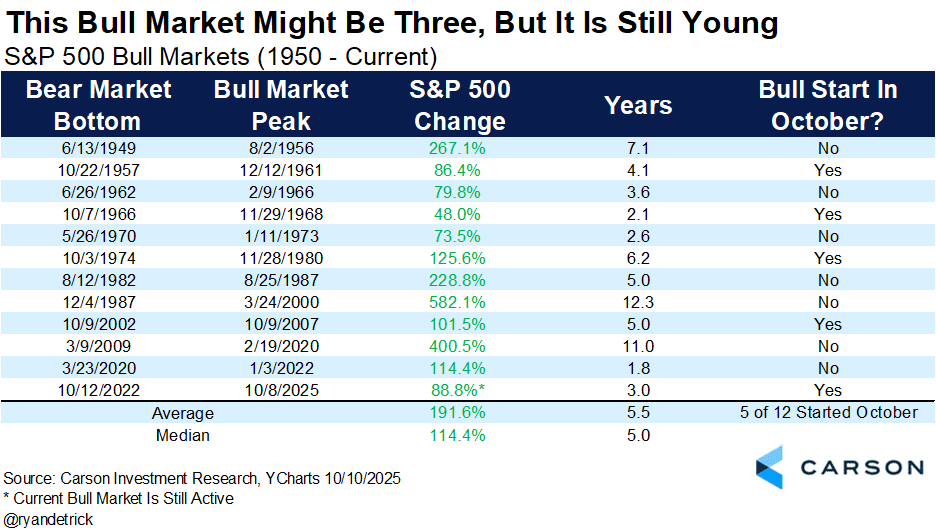
Our riddle is where are we in terms of the market cycle? Ryan Detrick from Carson considers this market to be relatively youthful at three (3) years, versus the average and median of around five (5) years. So, maybe four feet, maybe two feet.
Over the near-term, valuation does not matter that much, and momentum typically begets more momentum:
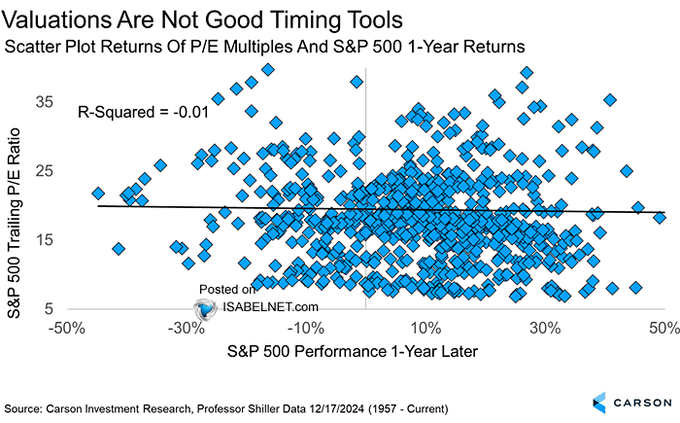
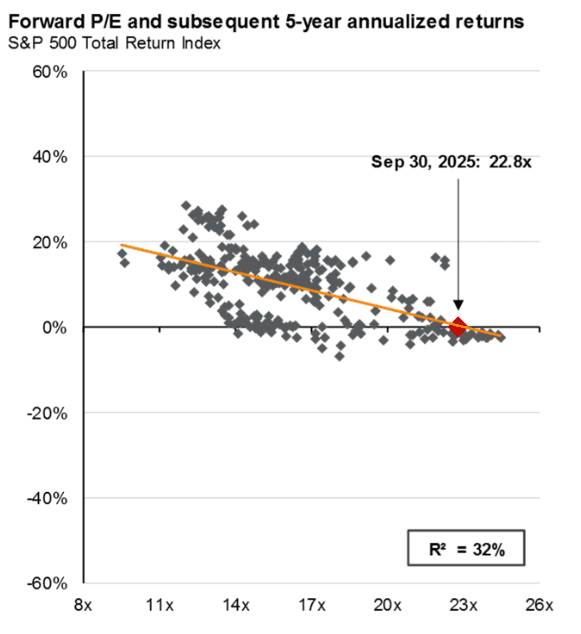
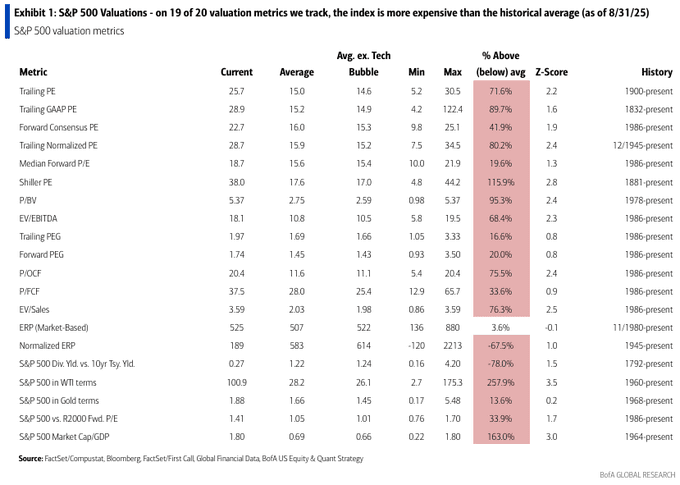
While valuation is not a useful tool over a one-year horizon, it matters over a longer horizon and would definitely point to this market being in the three feet stage. (the answer to the riddle is man, and the three feet stage is an elderly man with a cane). It is not just P/E, but 19 of 20 commonly used valuation factors point to an overpriced market.
At its core, the tragedy of Oedipus occurs because his father took a prophecy at face value. As investors, market prophets are just as prevalent (and unreliable). Some bears are comparing the present situation to 1929, others to 1999, while flamboyantly dressed bulls say we are in the early days of a technology-inspired market boom.
Our job is to be prophets of neither doom nor boom. What we do know is the market dynamics have never been this disrupted by two vastly different forces. On the one end, passive investing (this article on passive investing has the click bait-y headline, “This is the dumbest stock market in history”. As the article states, “Index funds chase the crowd, but increasingly index funds are the crowd.” Or, in a more pointed take, “What this means is that fewer and fewer people are actually making a market in stocks using their brains. Most, as indexers, are just blindly buying — assuming that somebody else is minding the store.”
So, on one side we have passive investors, and on the other, short-term speculators. The best performing stocks recently? Those with the highest amount of call option buying, which are often also the most speculative, not to mention the most shorted.
Does the current mix of winners (index/mega-cap tech and meme stocks) make us want to put needles in our eyes? Candidly, the answer is, sometimes. However, our job is to maintain discipline and be among the increasingly smaller crowd of investors who choose to use their brains to make a market in stocks. As renowned value investor Oakmark recently wrote, the S&P 500, “has effectively become a highly concentrated, technology growth fund. Although investors have enjoyed the increased volatility on the way up, they need to be aware that the risk goes in both directions.” We added the emphasis, because that is a part of our job that goes unnoticed in times like this.
As the blind prophet in Oedipus states, “Alas, alas, what misery to be wise When wisdom profits nothing.” Sure, it has seemed that way lately, but risks can appear quickly. Your neighbor who was a crypto millionaire thanks to margin may have been wiped out in a single day on October 10th. According to Bloomberg, “More than 1.6 million traders were liquidated, according to data tracker CoinGlass.” Ultimately, risk management matters, diversification matters, and working with an advisor who has been through periods like these matters.
Part III: In-depth analysis of Key Factors
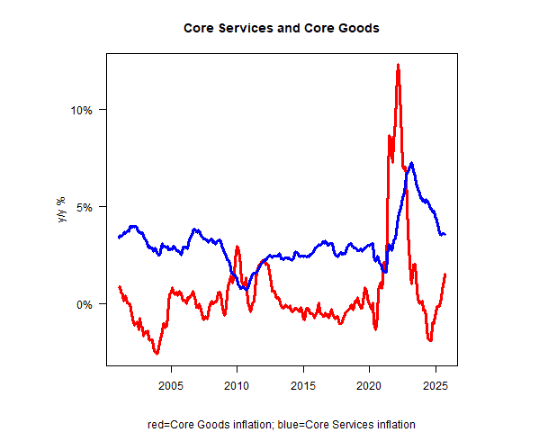
- Inflation – Negative but stable. In recapping September’s consumer price reading, Mike Ashton stated, “Median CPI will be around 3.6% y/y again. That’s where we are. We overshot my ‘high 3s, low 4s’ target to the downside a bit, but we’re back up in the mid-to-high 3s.”
Goods have seen sharp inflation (likely tariffs) and services have stabilized, so the path toward lower inflation looks challenging.
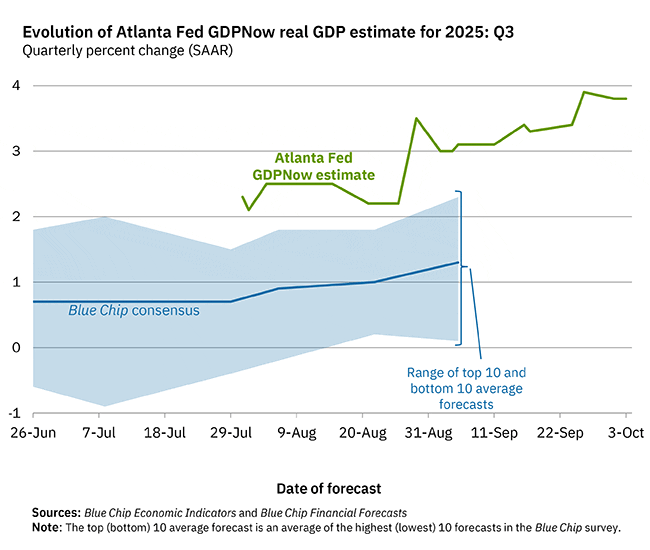
- GDP Growth – Improving and neutral. The Atlanta Fed’s volatile GDPNow estimate for Q3 has increased to almost 4%. Because of the government shutdown, we are not getting weekly updates. While employment data shows worrying signs of weakness, it has not been enough for economists to lower their forecast for Q3 growth, which is modest but still positive, i.e., no recession is in the cards:
- Fed Policy – Improving and neutral. At Jackson Hole, Chair Powell tacitly gave up on the Fed’s 2% inflation target, shifting the Fed’s emphasis to a focus on the labor market. Accordingly, the Fed cut the Fed funds rate by 0.25% at its September meeting, with the dot plot indicating more cuts to come. Mike Ashton was nonplussed, writing, “Let me make clear that I do not think that a wise Fed chair would even consider easing with median inflation steadying around 3.6%, and a 50bps cut would be laughable. However, this is not a wise Fed chairman, and this one is going to ease.” We tend to agree, though, paradoxically, this could be beneficial for nominal assets, like stocks and gold, which is why we push this to improving.
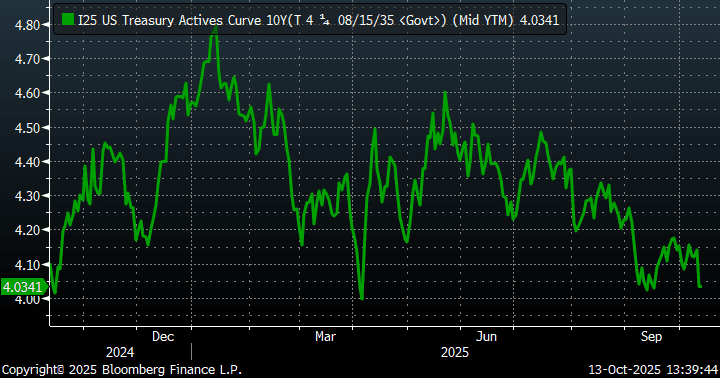
- Interest rates – Negative but stable. At around 4.0%, the 10-year yield is lower than where it was six to start the year, but flat over the last 12 months. Despite the Fed’s rate cut, rates remain above where the administration would like them to be for the purpose of lowering mortgage rates. However, against the backdrop of increasing fiscal deficits, a substantially lower rate may be difficult to achieve.
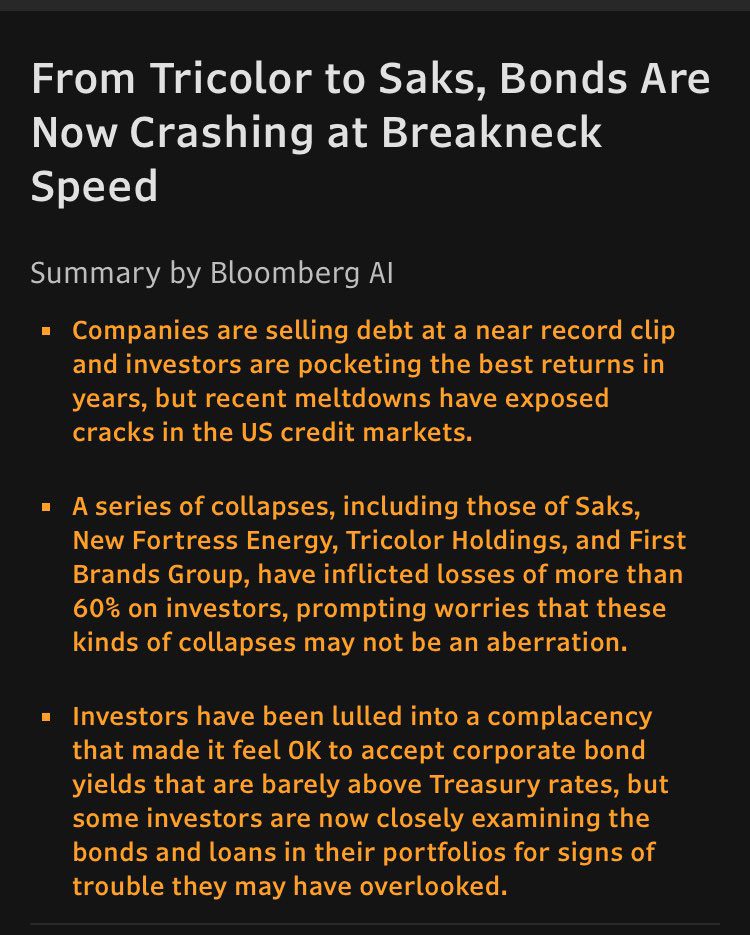
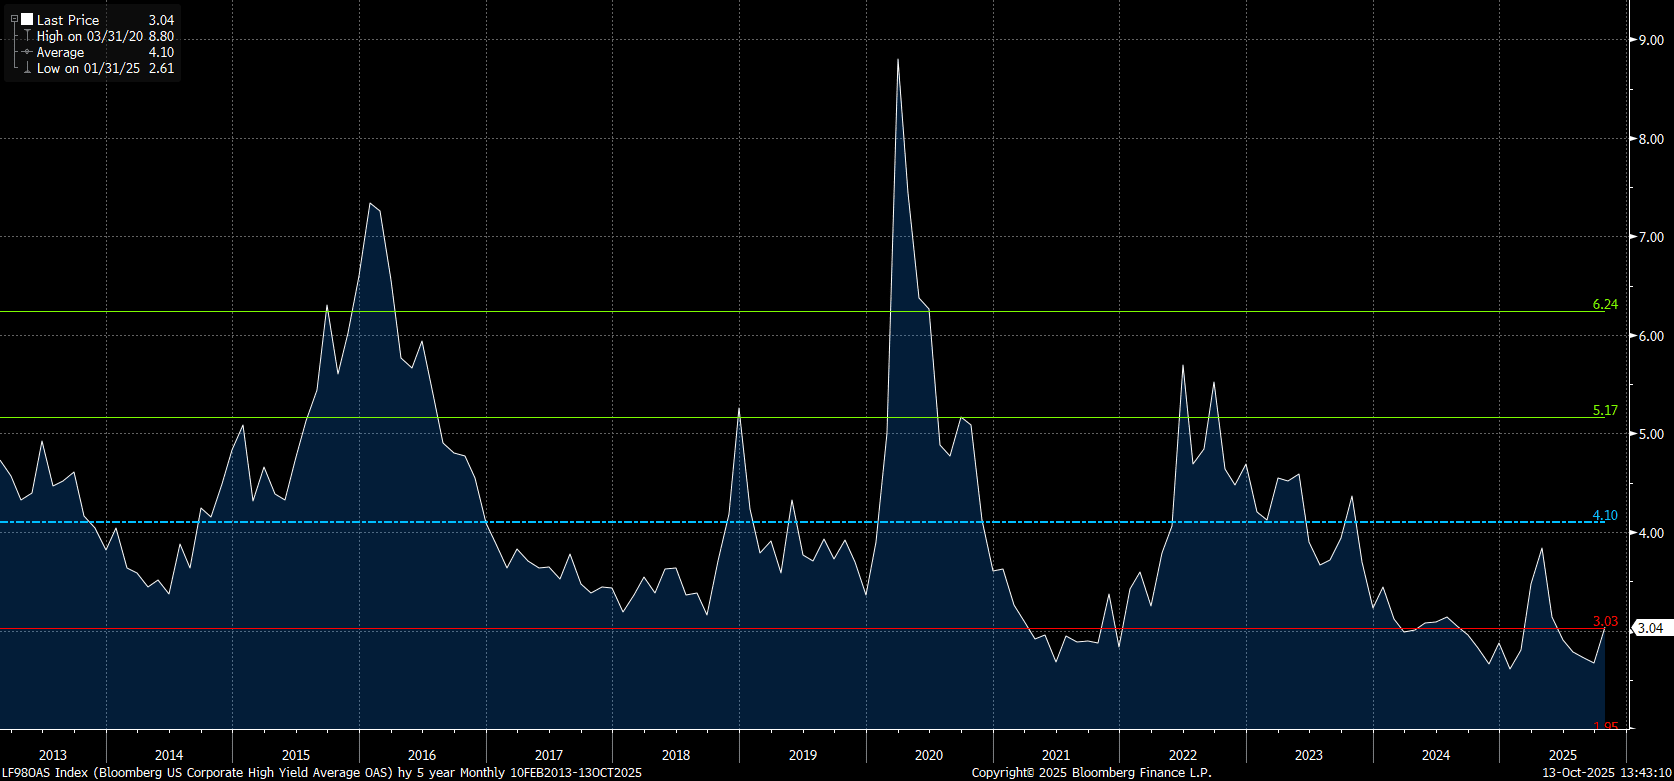
- Credit spreads – Negative but stable. A reminder we use this as a contrarian indicator. In other words, if we see spreads widening into the area above the green line, we may start to view risk/reward more favorably. Both high-yield spreads and investment grade spreads were near record lows at the end of Q3, but have started to move higher in the wake of a high-profile credit events.
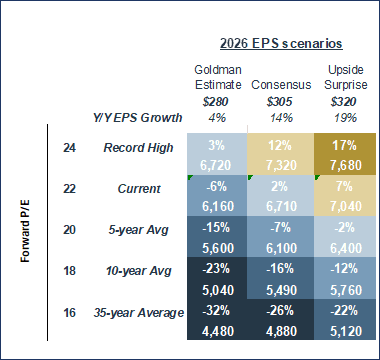
- Stock multiples – Negative and deteriorating. The S&P 500 has approached its 2021 peak. The top 10 stocks are overvalued versus their longer-term history, but below both their 2021 peak and their all-time highs from 2000. The other 490, despite on balance underperforming, are not inexpensive, either.
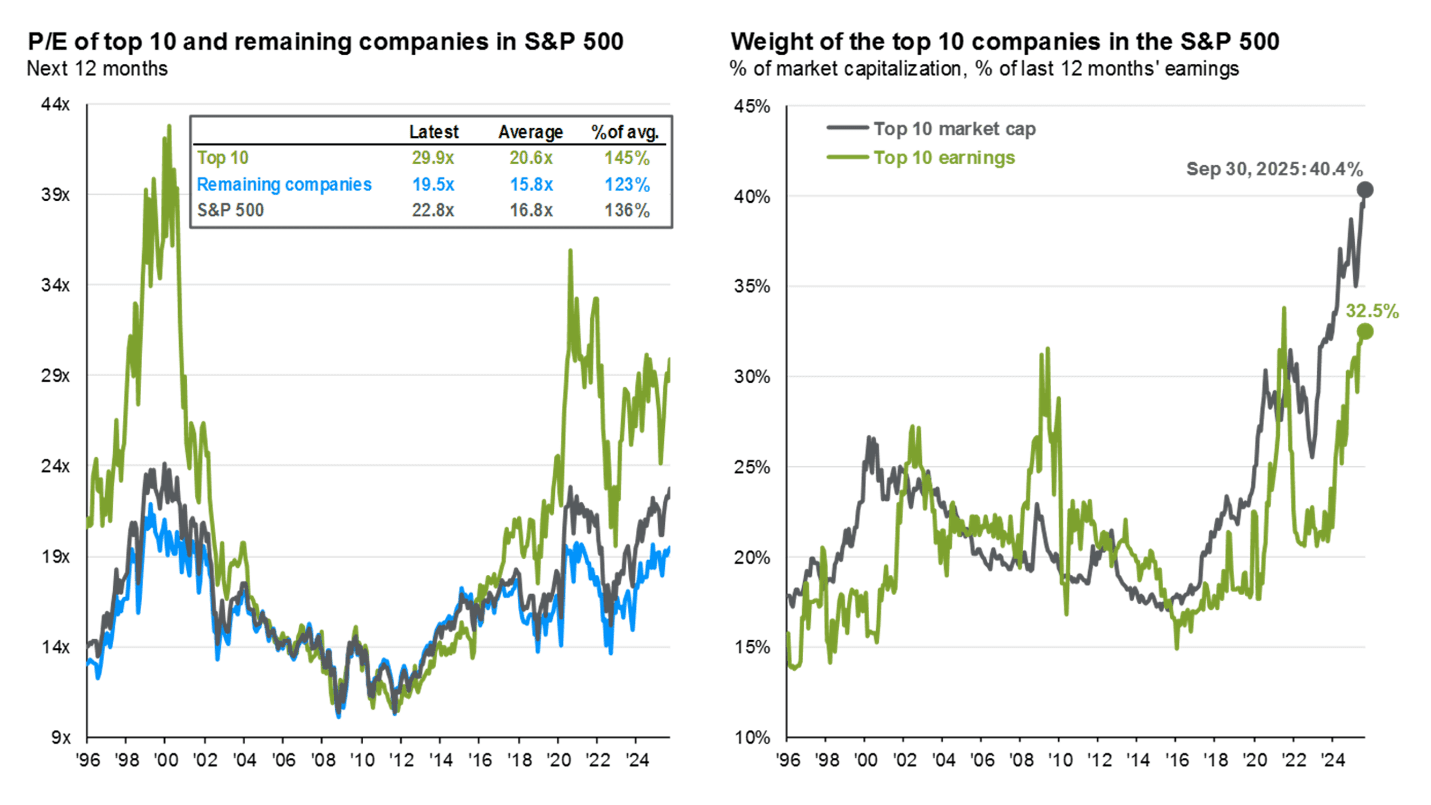
Source: J.P. Morgan
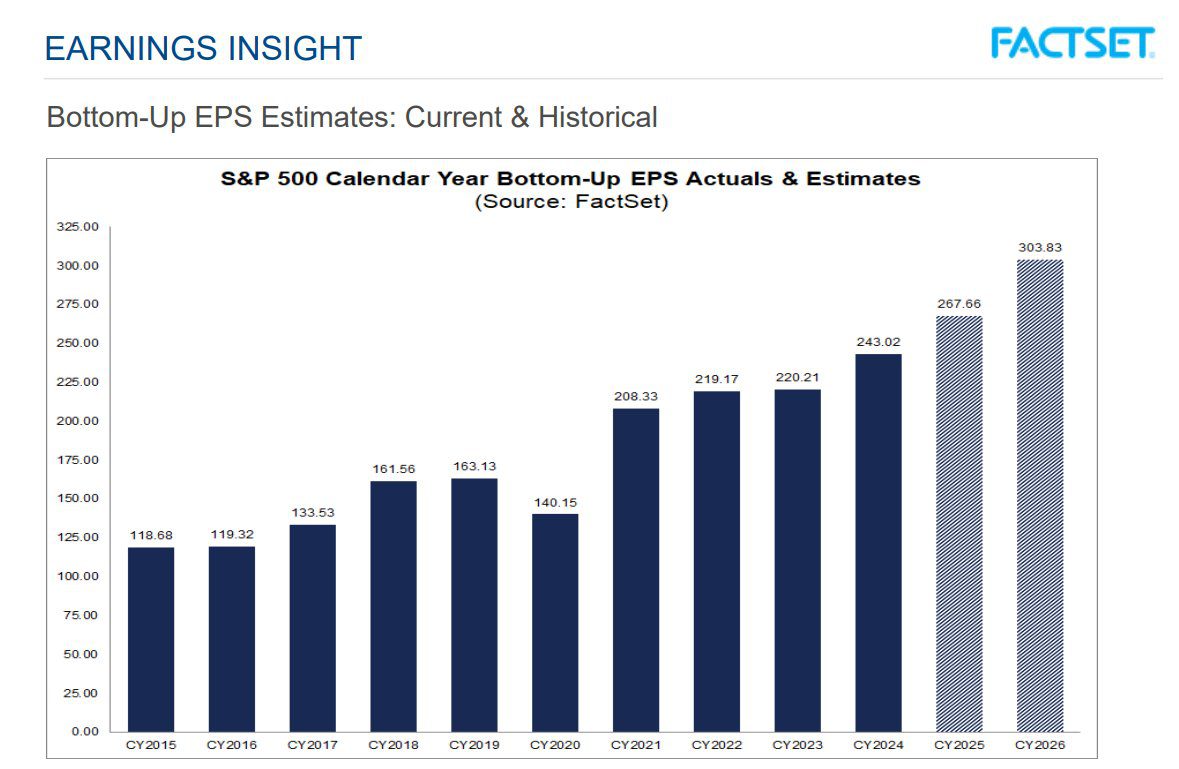
- Earnings growth – Positive and improving. Earnings are expected to grow 10% this year and 14% next year (both above long-term average). Margins are already close to peak, but perhaps the combination of modest GDP growth with above average inflation can help nominal earnings grow double-digits.
READY TO TALK?