


Market Commentary – August 2023 Update: The Barbie Market
August Update: The Barbie Market
Admittedly, this is a lazy theme, but when something is in the zeitgeist to this degree, why fight it?
I mean even I saw this movie!
August Update – Key Takeaways
- Returns for equities continue to be dreamy in 2023.
- While GDP growth remains resilient, other factors point toward a dose of reality.
- While investors remain transfixed by the attraction of stereotypical growth at any price, we look for opportunities elsewhere.
July Recap – “We sell dreams, imagination, and sparkle. And when you think of sparkle, what do you think of next?”
If you are Will Ferrell as the CEO of Mattel, the answer is female agency. If you are an “investor” at present, it’s AI. Yes, I know we have belabored this point for months now. However, it is worth repeating that dreams, imagination, and sparkle do not (over the long-term) make for stock outperformance.
Here’s the thing. The price you pay for a stock (in terms of its multiple of earnings or, in the case of many of these stocks, sales, since there were no earnings) matters. If we go back to the prior transformational technology, i.e., the internet, these were the companies that investors thought they needed to own regardless of price; each traded for a price/sales ratio of over 25.
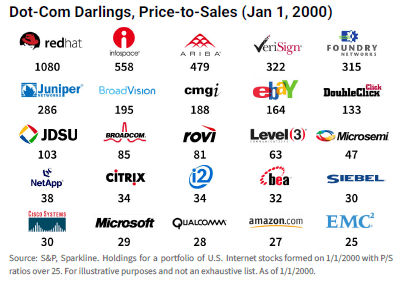
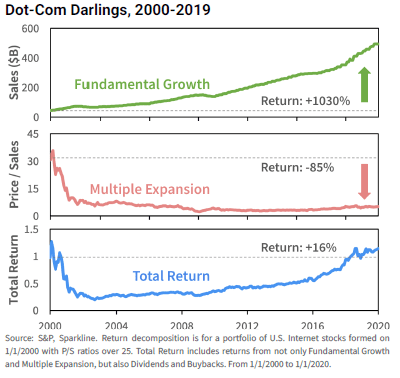
Some of these companies are today’s titans (Microsoft and Amazon) while others are no longer with us (CMGI and DoubleClick, to name a few). However, that really does not matter. What does matter is that, on balance, these companies achieved the growth many were expecting, growing revenues over 1,000% cumulatively over this 20-year period. For comparison, U.S. GDP growth was roughly 107%. So, these companies grew around 10 times faster than the overall economy.
However, this high growth was already built into the price of these stocks. Over the next 20 years, multiples on these stocks compressed significantly; in other words, these growth expectations were in the price of the stocks at the time. Multiples for the high-flyers compressed 85%, and investors in these names would have been underwater until around 2018. The 16% total return underperformed the S&P 500 over this period by over 200% cumulatively.
On the positive side, we did see a modicum of broader participation in equity strength in July. Although tech stocks, i.e., the NASDAQ, outperformed, small cap stocks, as measured by the Russell 2000, also outperformed. However, we would be remiss in not noting that the performance among smaller companies was led by a small cohort of highly shorted, speculative stocks, with the Goldman Sachs most shorted basket up almost 17%.
| Index | 1-Month | 3-Month | YTD | 1-Year |
| S&P 500 INDEX | 3.21 | 10.51 | 20.64 | 12.99 |
| Invesco S&P 500 Equal Weight E | 3.50 | 7.18 | 10.68 | 8.12 |
| NASDAQ Composite Index | 4.08 | 17.58 | 37.72 | 16.84 |
| Russell 2000 Index | 6.11 | 13.67 | 14.67 | 7.87 |
| MSCI EAFE Index | 3.26 | 3.53 | 15.82 | 17.55 |
| MSCI Emerging Markets Index | 6.28 | 8.56 | 11.65 | 8.76 |
| Bloomberg US Treasury Total Re | -0.35 | -2.25 | 1.23 | -4.01 |
| Bloomberg US Agg Total Return | -0.07 | -1.51 | 2.02 | -3.37 |
| Invesco DB Commodity Index Tra | 8.72 | 4.75 | 0.12 | -4.91 |
Source: Bloomberg (as of most recent month end)
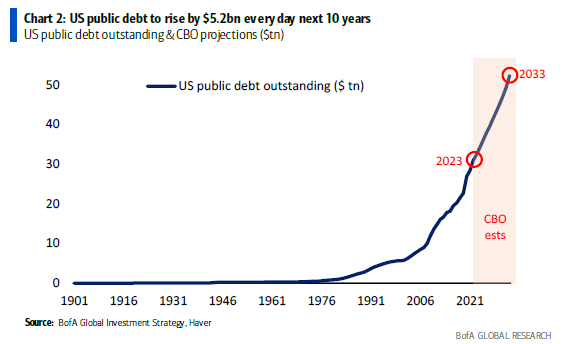
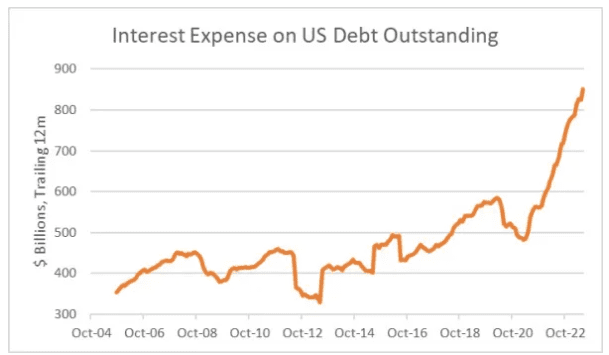
We should mention that bond returns lagged, with the Fed raising rates and ratings agency Fitch downgrading U.S. debt to AA+ (from AAA). The combination of explosive fiscal spending (COVID-19 relief as well as the Inflation Reduction Act) and higher interest rates have put the U.S. on an unsustainable fiscal path. Will the U.S. default on its debt? Highly unlikely. Are there consequences for rampant spending and soaring debt expenses? Yes.
August Outlook – “Do you guys ever think about dying?”
This is what stereotypical Barbie says as she starts to question the nature of her existence. Based on our assessment, investors have not had a similar realization in 2023, as our key indicators universally point toward caution whereas most market participants are more in line with pre-epiphany Barbie’s view, that, “It is the best day ever. So was yesterday, and so is tomorrow, and every day from now until forever.” Hence, why we are calling this the Barbie Market.

The seven key factors we track showed slight change month-over-month and are still very much skewed toward caution:
| More Negative | Neutral | More Positive | |||
| Inflation | ≈ | ||||
| GDP Growth | ≈ | ||||
| Fed Policy | ≈ | ||||
| Interest Rates | ≈ | ||||
| Credit Spreads | ≈ | ||||
| Stock Multiples | ← | ||||
| Earnings Growth | ≈ | ||||
| Deteriorating | ← | ||||
| Stable | ≈ | ||||
| Improving | → | ||||
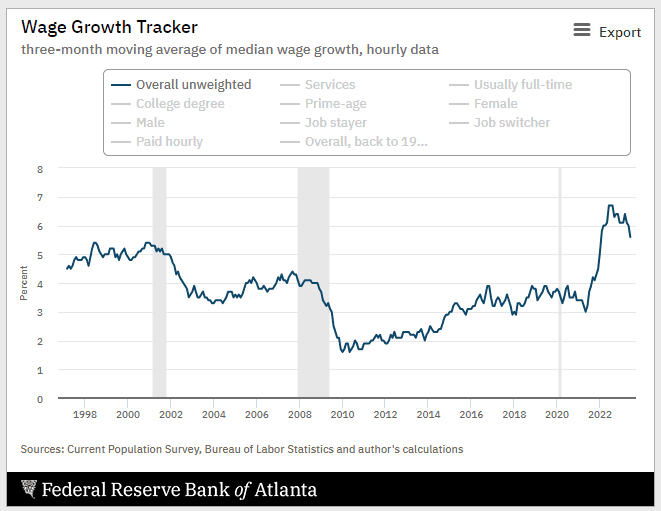
- Inflation – Negative but stable. June core CPI came in at a paltry 0.16%, which would annualize to around 2%, which is the Fed’s target. Time to celebratMike Ashton, a.k.a., the Inflation Guy, stated “We need to remember that prior to this figure, there was strong stasis at about 0.4% for core CPI. It’s difficult for me to believe that we jumped from ~5% annualized to ~2% annualized on core, without a stop in between. That being said…this sort of number is great for stocks, and great for bonds, compared to just about any other print. I don’t necessarily think it’s a sign of a sea change, because the big slow-moving parts of CPI aren’t decelerating very quickly. But I can understand the enthusiasm in the markets among those who ignore value and ‘just trade the number.”As discussed, we think June’s CPI number, mathematically speaking, was most likely the nadir, given how the base effect math of CPI works. Accelerating energy prices are unlikely to help inflation going forward, and wage growth, though off its peak, remains elevated at over 5%. Accordingly, we keep inflation in the negative column.
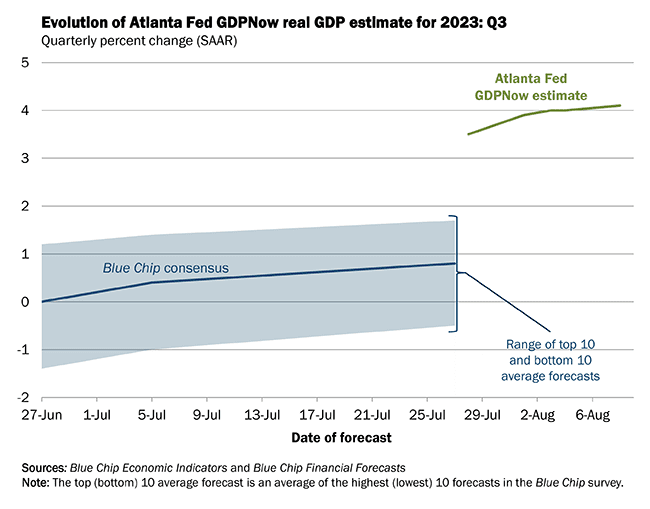
- GDP Growth – Negative but stable. Employment data and Fed GDP estimates for Q3 would argue for this to move to neutral, but given that a) employment is a lagging indicator, and b) the Fed’s estimates are notoriously unreliable, we leave GDP Growth unchanged. Additionally, both BofA and JP Morgan threw in the towel on their recession forecasts.
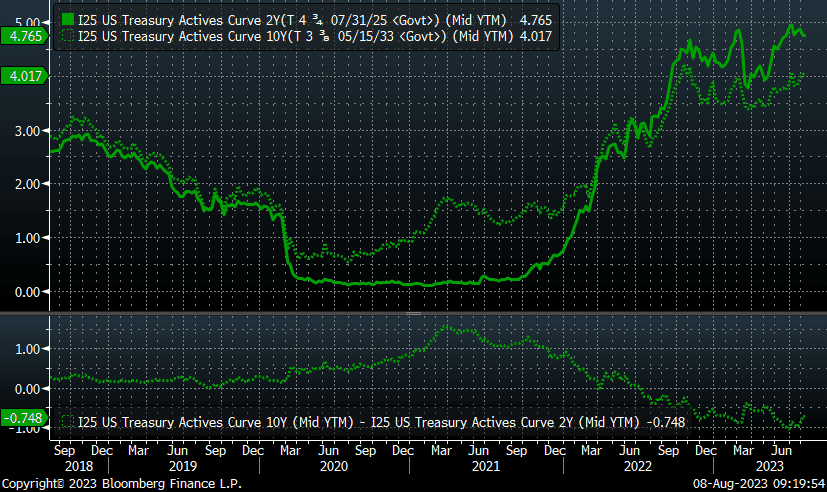
The inversion of the 10-2 curve remains sizable, as well as volatile, dipping from over 100 basis points to 74 basis points. 10-year bond yields have been swinging wildly to start August, and the slight dip in the solid green line (the 2-year Treasury) is worrisome, as the only thing worse than an inversion would be an un-inversion due to the 2-year falling.
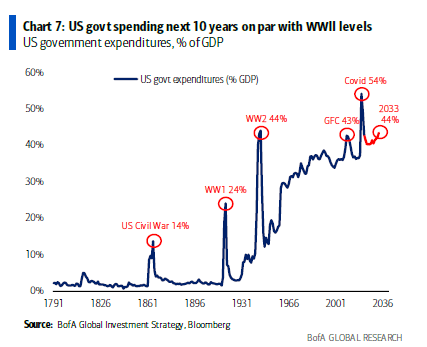
However, it is hard to underestimate the massive amount of government spending and its stimulative effect. At 44% of GDP, we are spending more than during the GFC or World War II.
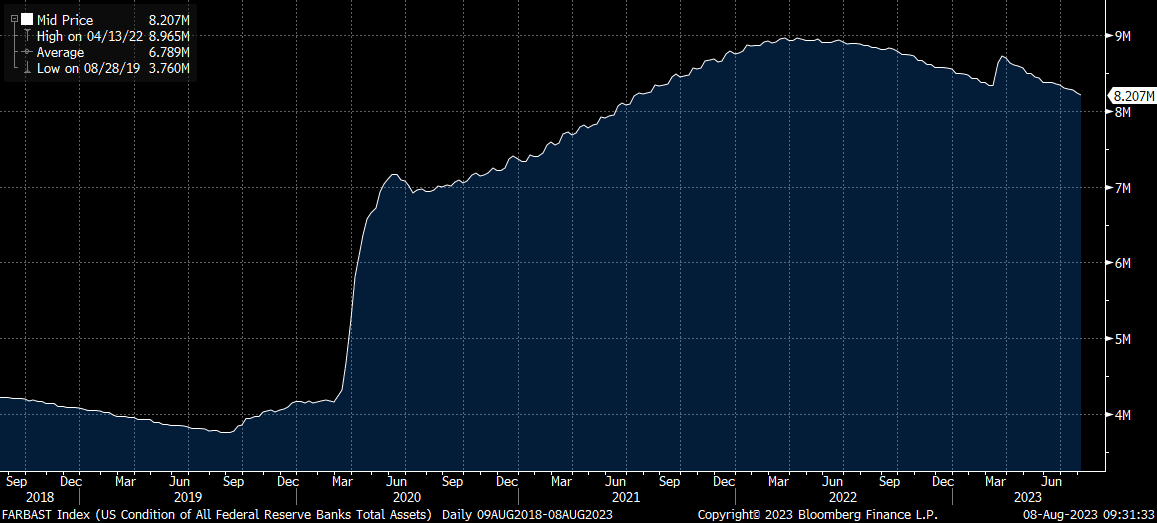
- Fed Policy – Negative but stable. Quantitative tightening has removed the excess liquidity infused in the wake of the Silicon Valley Bank collapse.
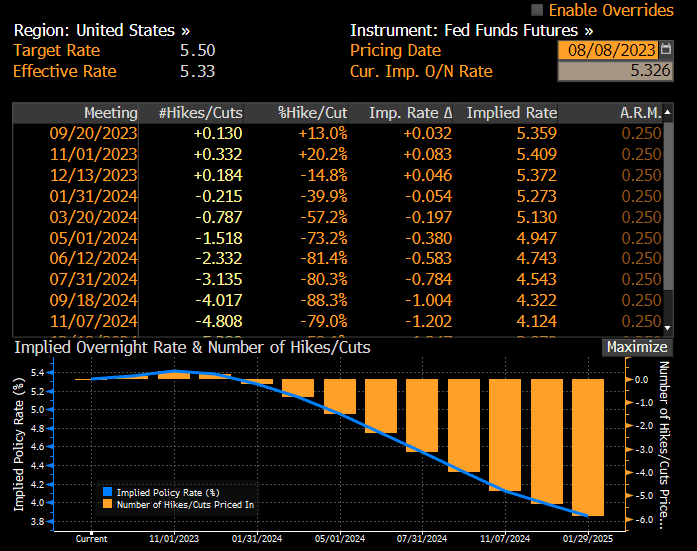
The market is not expecting further rate hikes, but instead cuts, starting in January. A rapid series of cuts would be concerning and likely lead to the aforementioned un-inversion we find so concerning.
- Interest rates – Negative but stable. The 10-year Treasury continues to hover around 4%. Rates paid by consumers on mortgages, credit cards, and auto loans are burdensome at these levels, but debt service is nowhere near as stretched as during the lead-up to the financial crisis in 2007.
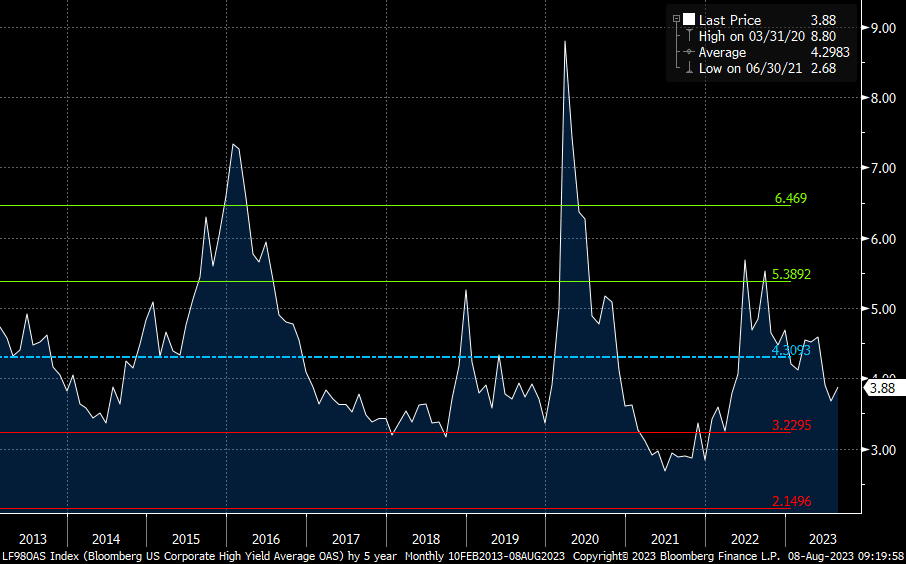
- Credit spreads – Negative but stable. A reminder we use this as a contrarian indicator. Spreads are indicating no stress despite bankruptcies soaring. We think a structural issue with constricted high-yield bond supply may be causing an aberration.
- Stock multiples – Negative and deteriorating. We will state this again: stocks are not cheap at the index level. The top 10 stocks are even more overvalued, and the S&P 500 Index is as concentrated as it has even been.
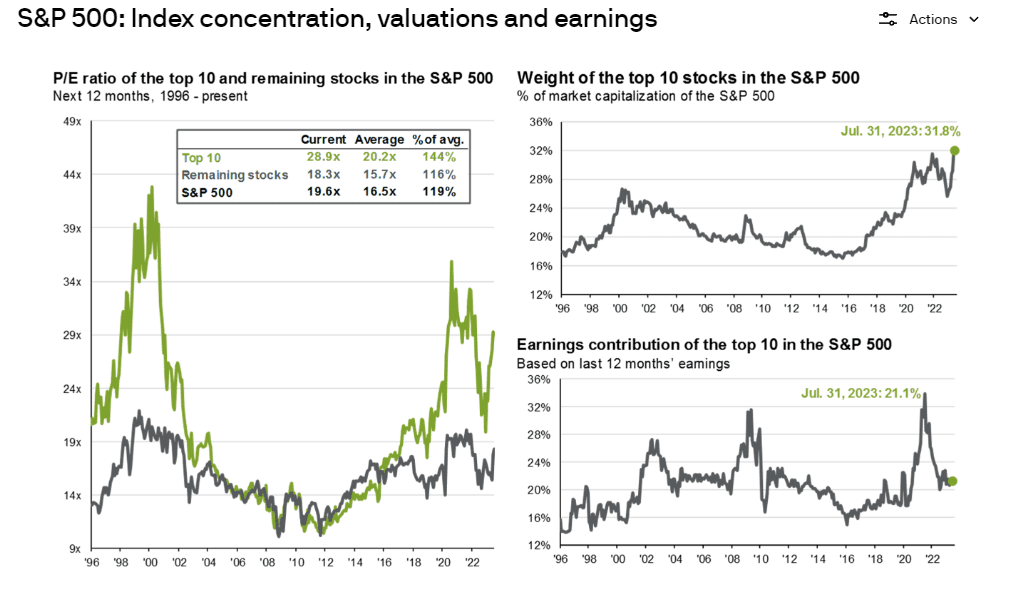
From a style box perspective, only small value stocks trade below their long-term average P/E multiple; large cap growth stocks trade at a 46% premium. From a sector perspective, only one sector, energy, trades at a meaningful discount versus history.
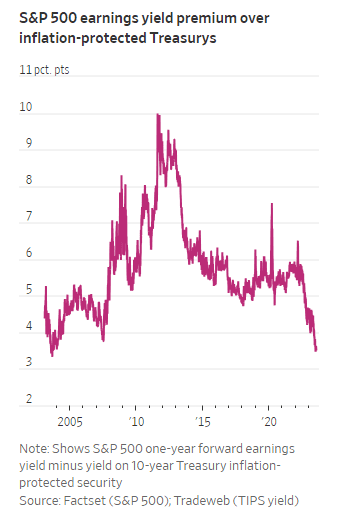
Most damning is that – relative to fixed income – the premium to own equities has not been lower since the lead-up to the financial crisis.
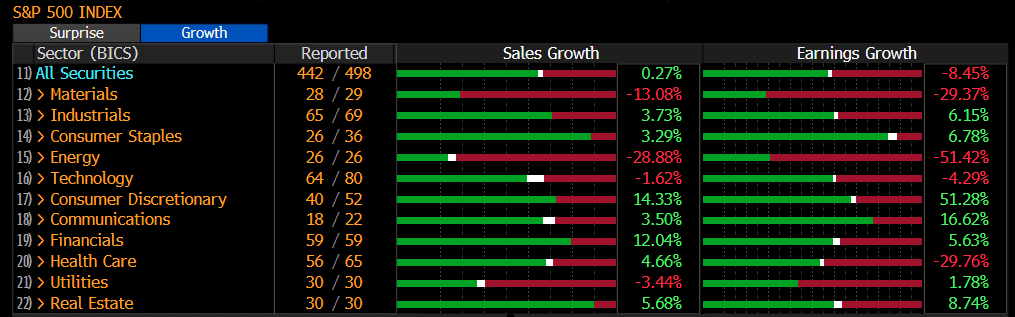
- Earnings growth – Negative but stable. Earnings have been poor in absolute terms (-8%) but better than expectations (+7% on earnings surprises).
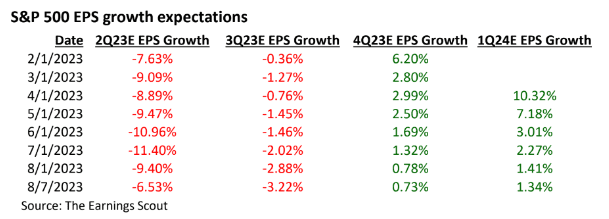
Forward earnings expectations are not falling quite as rapidly, but should the market trade at an elevated multiple, given these paltry growth expectations?
Conclusion – “When I found out the patriarchy wasn’t about horses, I lost interest anyway.”
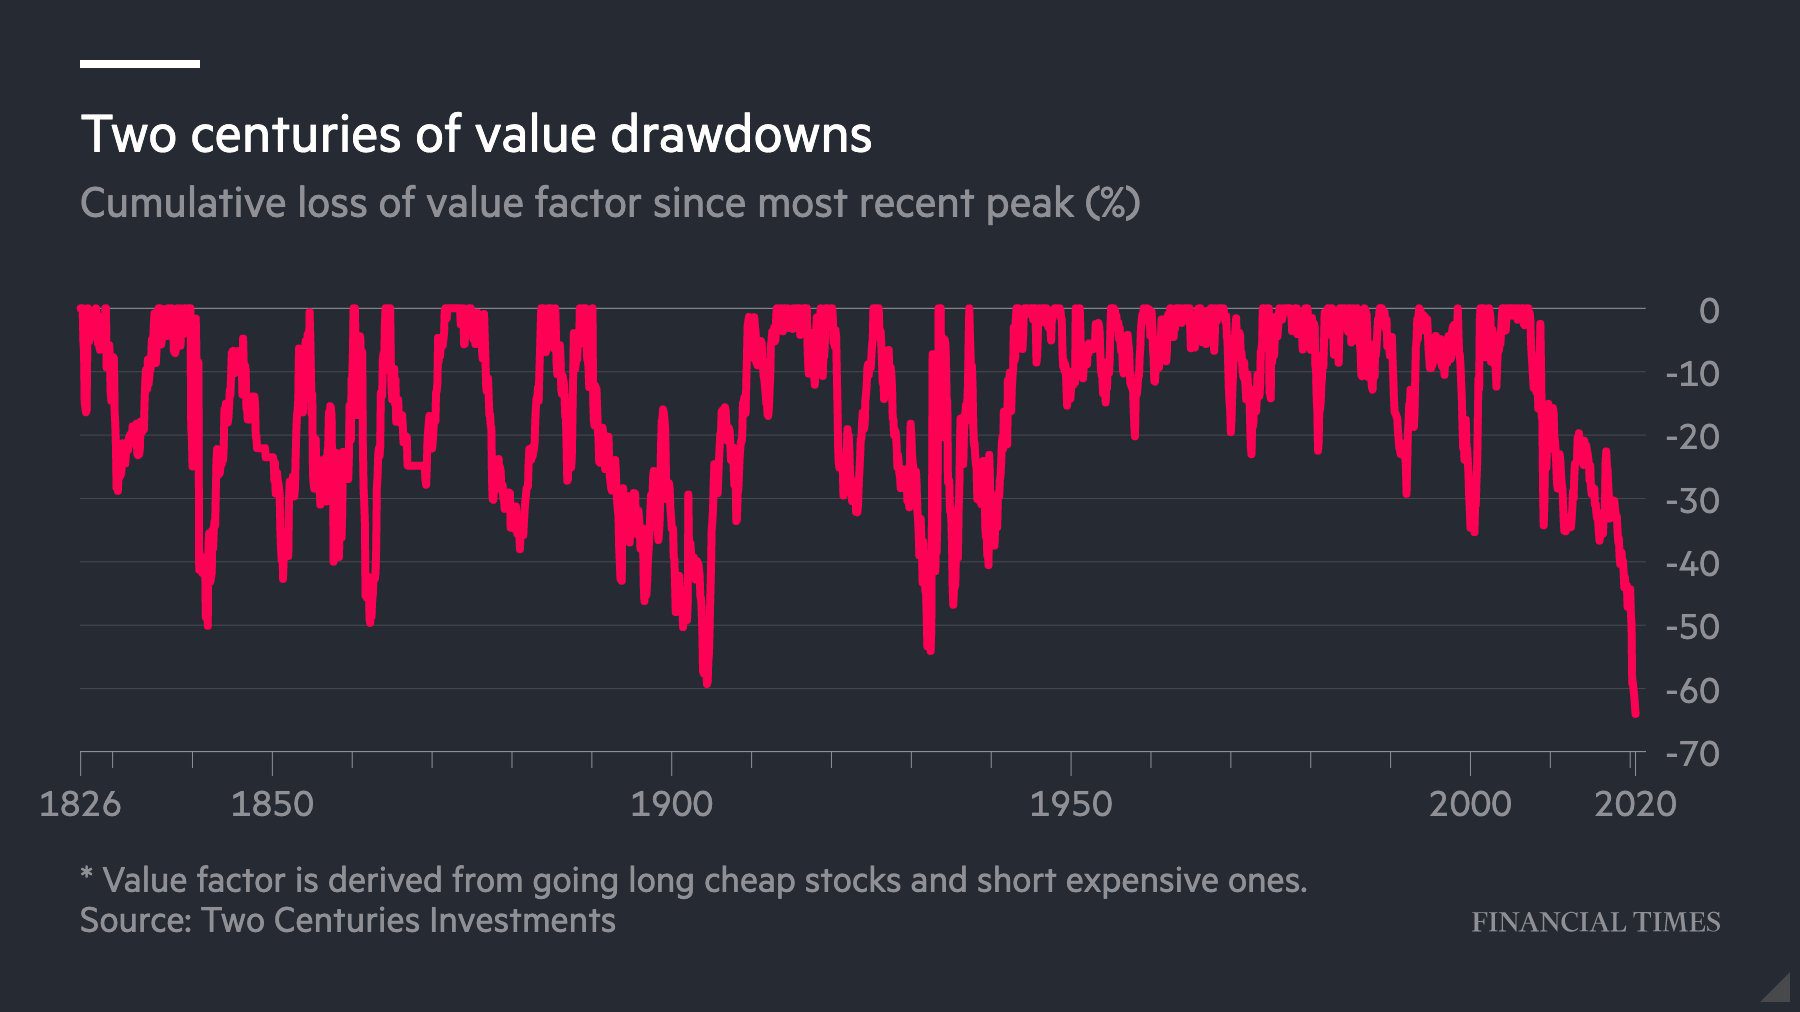
Replace “patriarchy” with “market,” and “horses” with “valuation”, and you can describe the frustration some of us have today. This has been the worst relative performance for value since the John Quincy Adams administration. I take these data points with a grain of salt, but just the same, let’s just agree it has been a long time since value has been in the Dream House.
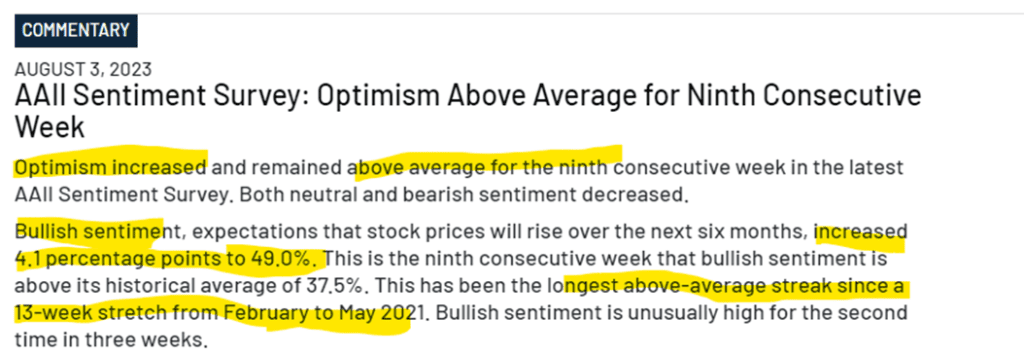
Investors are feeling good, as we see in the following AAII investor survey. Anecdotally, fear has been replaced by fear of missing out. Investors are anchored on outsized year-to-date returns for a highly concentrated, overvalued index. We wrote about this topic for Forbes and encourage investors to give it a read.
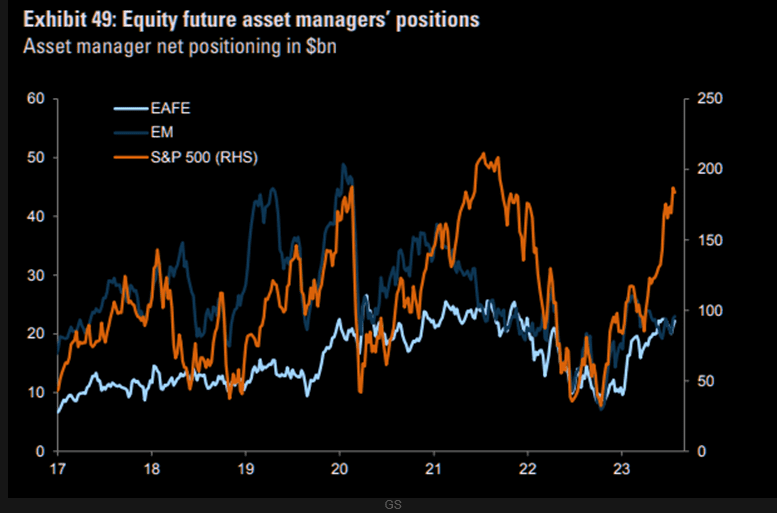
Asset managers are also nearing record long positioning in the S&P 500:
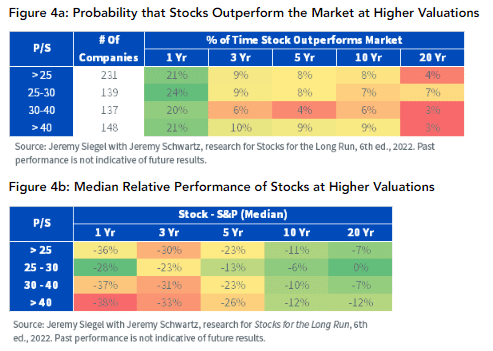
We found this study by WisdomTree to be compelling. It shows that the longer your time horizon, the less likely it is that owning today’s highly valued stocks sets you up for outperformance. Over a one-year period, odds are less than one in four, whereas for periods longer than a year there is a 10% (one in ten) or less chance of outperformance.
In addition to worse odds of success, the magnitude of underperformance for the most expensive stocks is shockingly large (almost 40% for stocks with a Price/Sales over 40) over a one-year period.
In the spirit of worlds (or, in this case, newsletter themes) colliding, Barbie’s exit from Barbieland is set to the sounds of the Indigo Girl’s Closer to Fine, which is covered by prior newsletter inspiration Brandi Carile. As the song states, “darkness has a hunger that’s insatiable. And lightness has a call that’s hard to hear. And I wrap my fear around me like a blanket. I sailed my ship of safety till I sank it.”
Markets are the same. Although we advise caution in this environment, we continue to allocate to equities and find opportunities. Becoming overly pessimistic can be just as dangerous as being overly optimistic. However, we would note that the stock equivalents of stereotypical Barbie (attractive growth profiles with some AI cache) are most certainly not in the discount bin at this point. Accordingly, we look more for the investment versions of Allan. Perhaps not as glamorous, maybe even a little bit weird, but the only character in touch with reality.
READY TO TALK?