
Commentary July, 2020

July Update
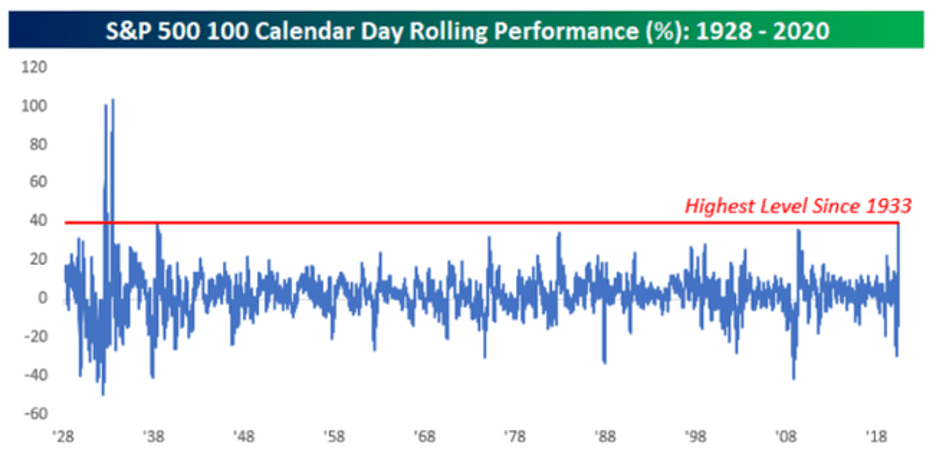
“It was a bright cold day in April, and the clocks were striking thirteen.” Back in April, if you were to tell investors we would see the best 100 days performance for the S&P 500 since the 1930s (Graph One) while unemployment was at record levels (13.3% officially as of May, though over half the population is jobless), they would have seen it as just as implausible as a clock striking thirteen in the first line of George Orwell’s 1984. However, in a quarter that can only be described as Orwellian for any number of reasons, here we are.
Graph One
The book’s protagonist, Winston Smith, is held prisoner in the Ministry of Love. While not that type of prisoner, as one of our new clients eloquently stated, we are “prisoners of the moment”, which works on so many levels.
This struck a chord and started me thinking about a concept integral to game theory (and, accordingly, investments) – the prisoner’s dilemma (I’ll spare you the dissertation; click here if you want to learn more). Though not a perfect proxy, we are in an environment where the level of cooperation among individual participants (be they in markets or society) has an outsized effect on outcomes.
We’ll set aside social hot button issues and focus on the cooperation that helped the S&P 500 post its best quarterly return since 1998. Specifically, politicians in Washington cooperated on massive fiscal stimulus ($2.4 trillion currently, which is almost 12% of GDP) and the hawks and doves at the Fed (not sure there are any hawks left) cooperated by agreeing to massively expand its balance sheet ($2.9 trillion currently) and lower rates to the zero bound. While the dour among us would think this must be a good time to sell, history shows that, on balance, more gains follow (Graph Two).
Graph Two
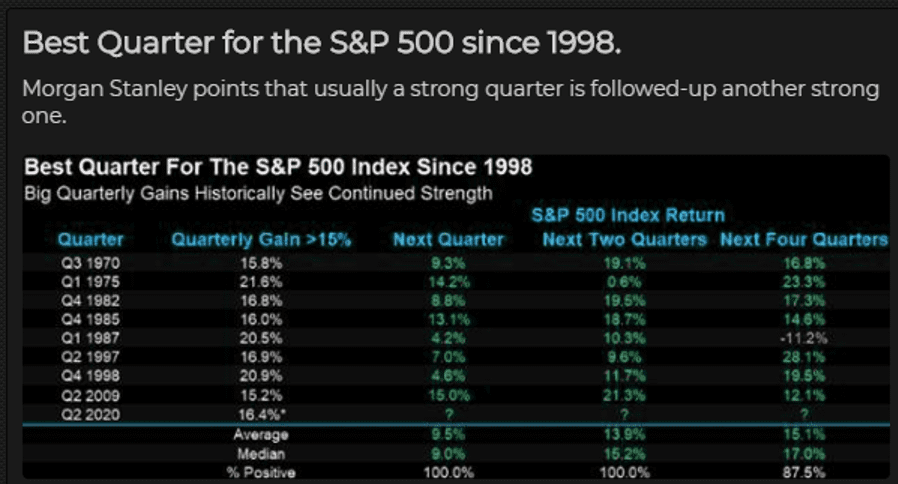
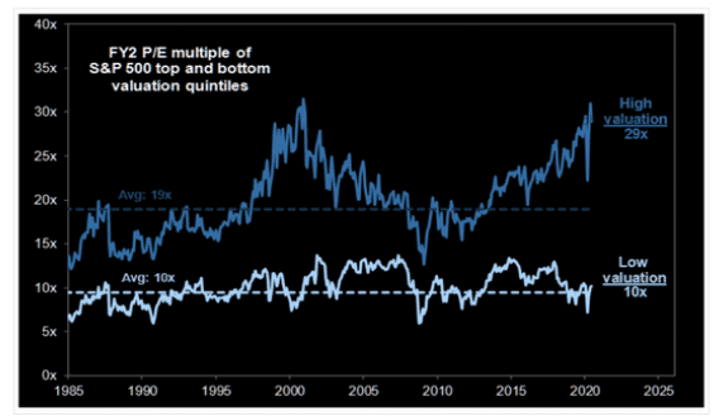
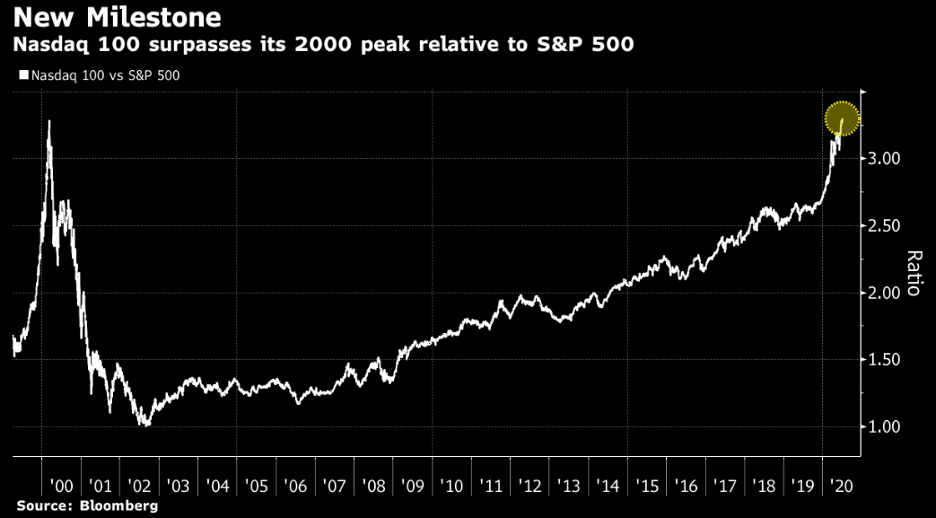
An important caveat is none of these prior periods occurred during a pandemic (more on that later). Pandemic aside, the current environment reminds us a great deal of the late 1990s, now pejoratively known as the tech bubble. For those of us who lived and invested through that era, the types of graphics we are seeing in terms of the outperformance of technology and growth stocks, and the accompanying astronomical values they are being accorded, are eerily familiar. As we see in the Graph Three, cheap stocks are priced about where they normally are (10 times forward earnings) while expensive stocks are almost three times that much (29 times forward earnings), well about their historical average and about where the level was before the tech bubble burst. Same is true when we compare the tech-heavy NASDAQ with the S&P 500 (Graph Four).
Graph Three
Graph Four
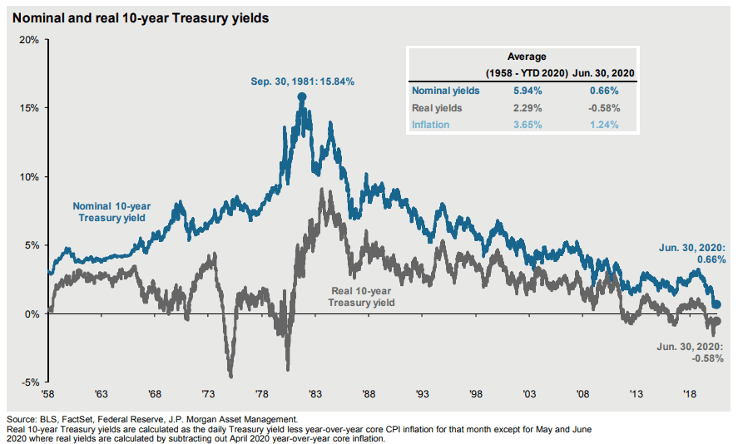
Speaking of historically expensive, let’s look at bonds. The 10-year U.S. treasury bond, considered a touchstone, yielded around 0.7% as of the end of June. Its real, i.e., inflation-adjusted, yield is -0.6%; yes, that’s a minus sign (Graph Six). Not that it’s apples-to-apples, but if we invested $100 in a 10-year Treasury, we’d earn $0.70, so our P/E would be 142. Given the aforementioned fiscal stimulus of over $2 trillion, financed by debt issuance that has boosted debt/GDP for the U.S. to levels last seen in World War II, the notion that rates are at these historical lows is an example of two plus two equals five.
Graph Six
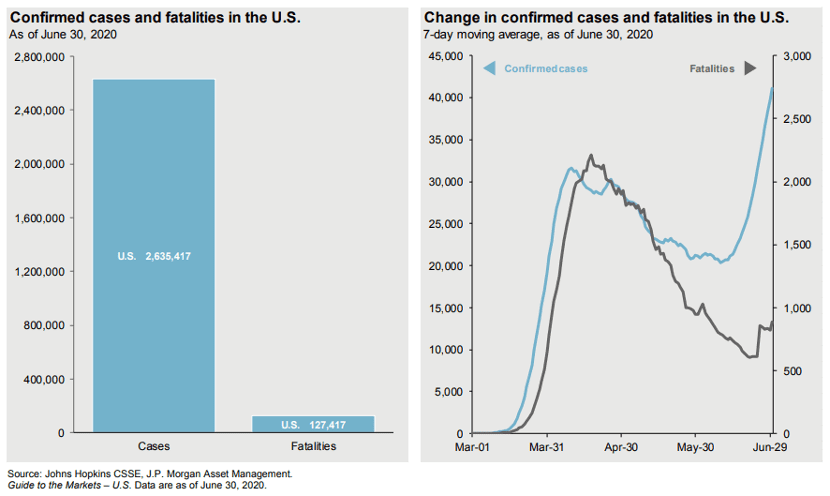
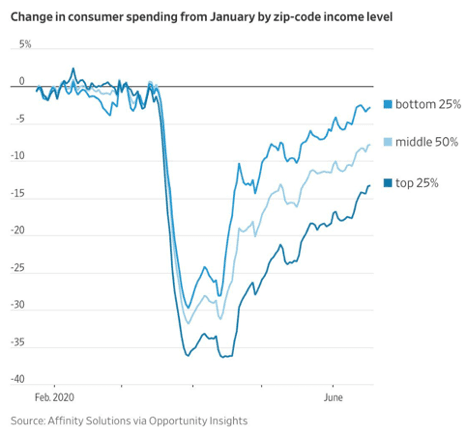
We won’t spend much time on the pandemic. There are worrying trends in terms of an acceleration in cases domestically as well as in Latin America and Southeast Asia (Graph Seven). At home, this could have implications for economic activity, which has strength (housing and traffic) as well as weakness (travel and restaurants). We can see spending by income level is widely divergent (Graph Eight), with those at lower income levels with the smallest decline despite being disproportionately affected by job losses (unemployment is almost 20% for those without a high school degree versus only 7% for those with a college degree.) Any re-closures would likely have a disproportionate impact, once again, on those at the lower end of the wage spectrum.
Graph Seven
Graph Eight
Before we close, we need to revisit a topic that is top of mind for a few reasons: the rise of the retail trader. Though maybe too pejorative, the mantra “Ignorance is Strength” has seemingly served many of these day traders well. Returns for highly speculative stocks, e.g., bankrupt entities, penny stocks, and $20 billion paperweights) have outpaced those of many higher quality companies, with the Davey Day Trader Global/Robinhood crowd piling into names and mocking the folly of “the suits”. One, we prefer to view stocks as fractional ownership in businesses we want to own, not pieces of paper to be shuffled off to someone we assume will pay us a little more next week because stocks “always go up”. Two, we, too, don’t like suits (my personal preference is a hooded sweatshirt).
So, what’s it all mean? We are not sure we have faced a tougher environment personally or professionally; many of you probably feel the same. 1984 ends almost as iconically as it begins: “But it was all right, everything was all right, the struggle was finished. He had won the victory over himself. He loved Big Brother.” Winston succumbed to the torture, the propaganda, and believed the untruth; he loved Big Brother. As prisoners of the moment, we must continue to believe in ourselves, our process, and our experience. Ignorance isn’t strength, and two plus two doesn’t equal five.
As always, the team at Formidable stands ready to help in any way possible.
READY TO TALK?