

April Update: Encanto
Our family drives…a lot. Unfortunately, the driver (usually me) does not control the music. That falls to the children, and recently the music has been almost exclusively the soundtrack to Encanto. As a Hamilton fan, I will grudgingly admit some of the songs are catchy. Having said that, the charm wanes after listening to the same song a dozen times on a three-hour tour. Just the same, given the fantastical and magical rally we saw in March, we will look at these charmed markets and see if they might last.
We Don’t Talk About…
The most popular song, by far, is the inspiration for this section:
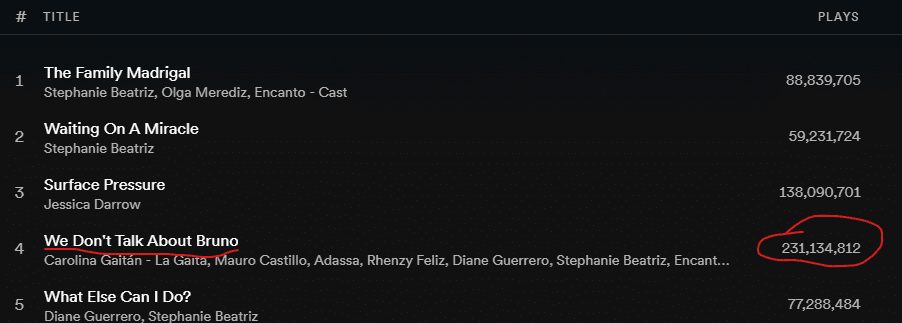
Bruno, the prophetic uncle, disappears after his visions are believed to cause calamities, including the death of fish, loss of hair, and rain at a wedding. After his departure, his name is not spoken.
Whenever I hear the song, I replace Bruno with Jerome, in homage to the current Fed chair. However, unlike Bruno, Powell’s prophesies have been wildly inaccurate. A little less than a year ago, we heard inflation was transitory. Accordingly, the Fed kept rates near zero and continued its bond buying for almost another year.
The narrative started to change in November, when Powell stated it was time to retire the word transitory as inflation rocketed to levels last seen in the 1970s. This brings us to a few weeks ago, when the Fed raised its benchmark rate by 25 bps, acknowledging the need to battle inflation, which has proven anything but transitory.
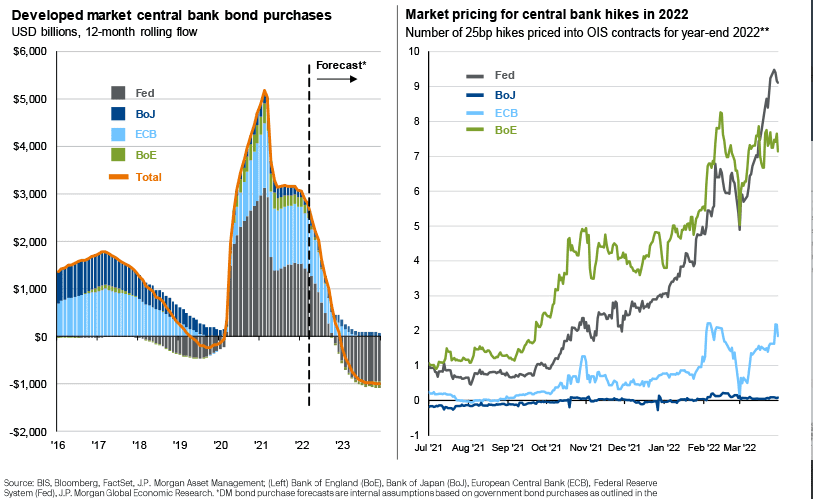
When we wrote our prior market commentary, expectations were for six (6) rate hikes over the next 12 months; the market now expects it will happen nine times. This would put the overnight rate at 2.6%, above the current yield on the 10-year Treasury (more on this later).
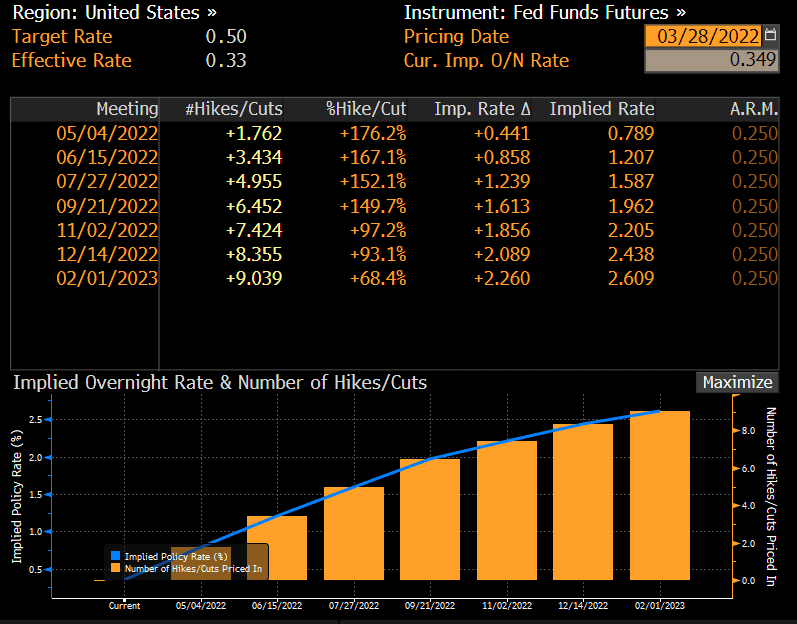
The other tool the Fed has, reduction in its balance sheet, has not yet begun. In fact, according to the most recent data, the balance sheet has continued to expand recently, though the data here can reflect a delay.
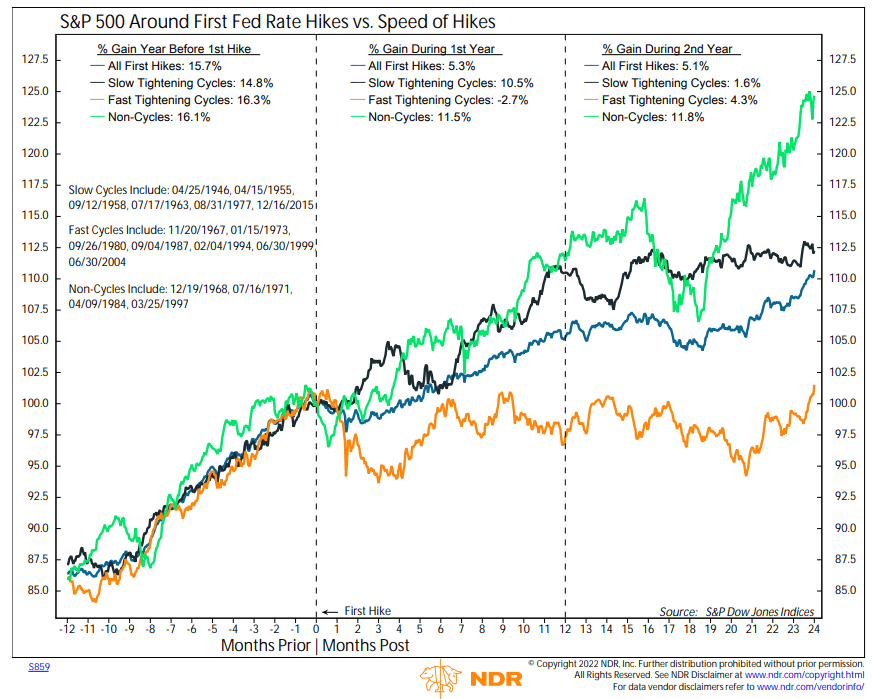
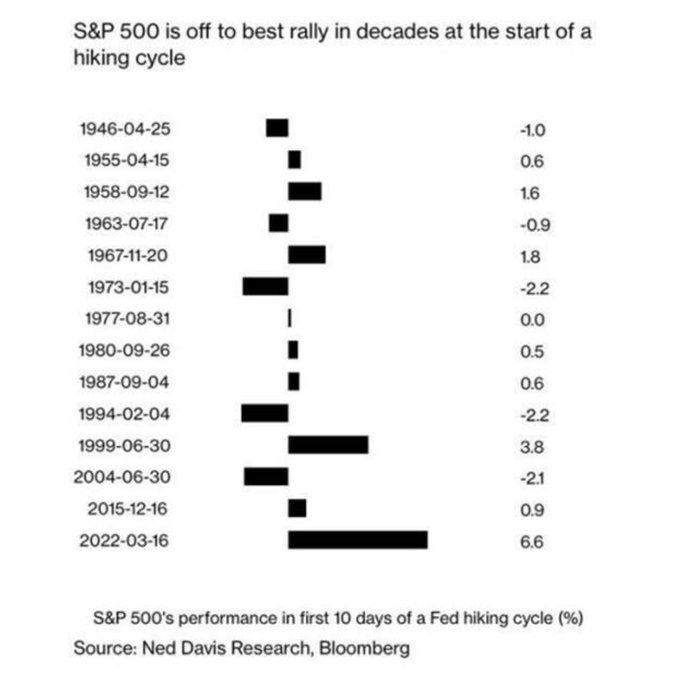
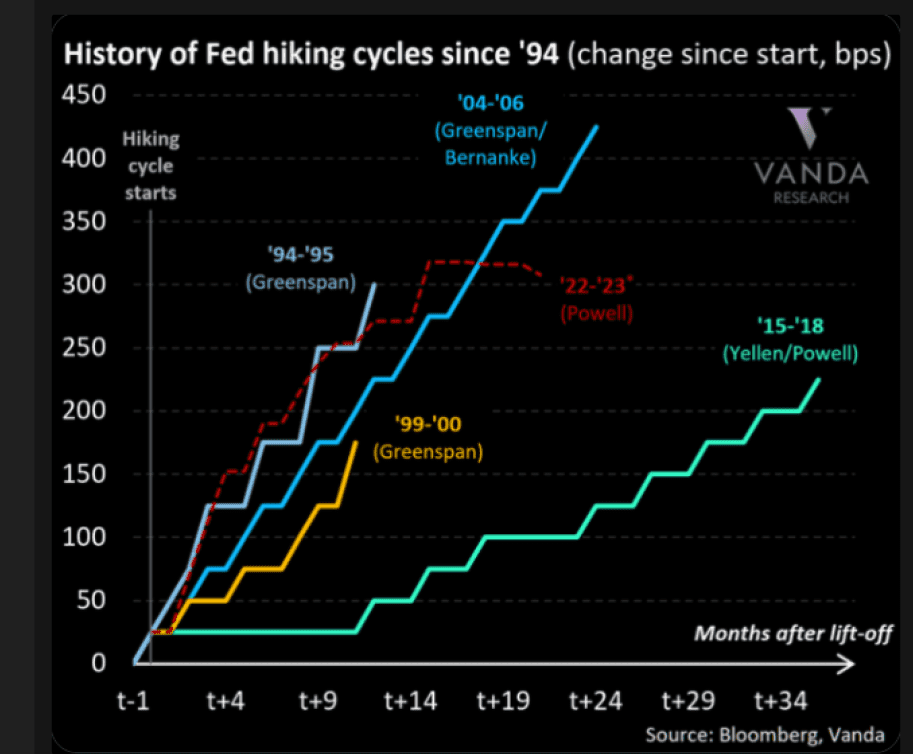
If the Fed follows through at this pace, history would indicate lackluster forward returns:
Waiting on a Miracle
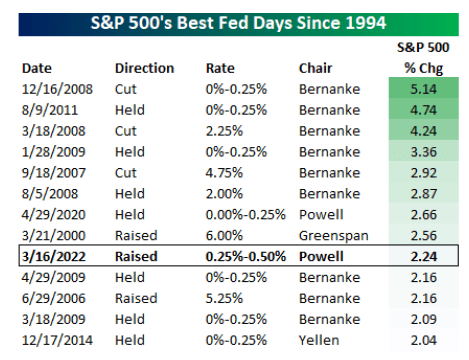
Despite the Fed’s hawkish pivot, large cap equity indices have posted their strongest post-Fed returns since the 1940s. The 10-day rally rates in the 98th percentile of all-time best performances for the S&P 500 Index.
In fact, returns have been so good that one of the more inexplicably popular contrarians has dubbed the bear market “over”.
Minor correction (pun intended), is that the S&P 500, as an index, never entered a bear market, though the NASDAQ and Russell 2000 officially did, as did many individual stocks.
So, equity investors believe the Fed will be able to engineer a “soft landing”, to use Powell’s own words. Call this a hot take, but this could rank up there with the ignominy of calling inflation transitory in about a year or so.
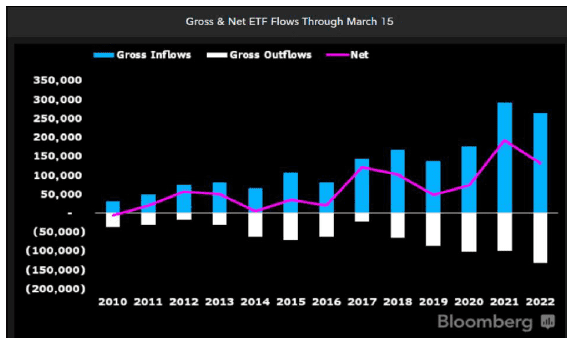
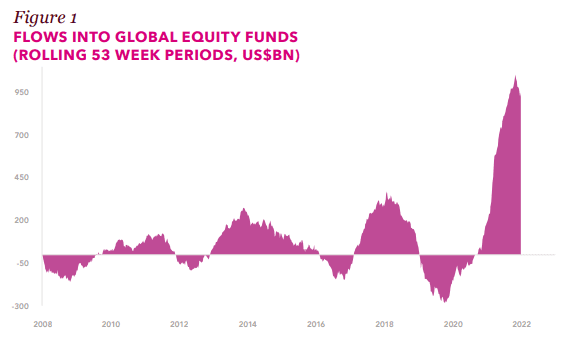
However, investors, and we use that in the loosest possible sense, especially retail, continue to believe the narrative, and we have seen ETF inflows second only to 2021 so far this year:
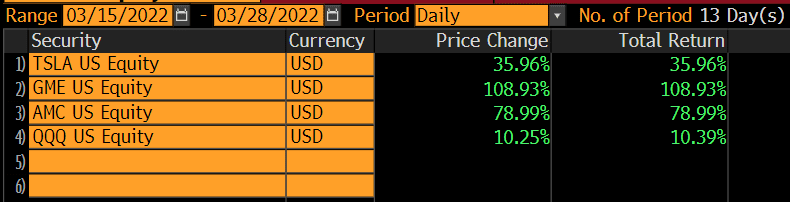
Moreover, since the Fed meeting on March 15th, we have seen retail and meme stocks returns with a vengeance. In just nine (9) trading days after the meeting, GameStop more than doubled, while AMC was close behind.
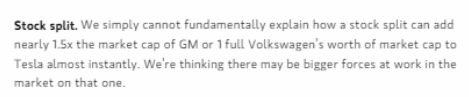
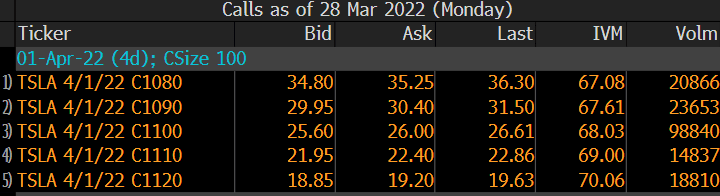
Tesla announced a stock split, which added roughly a Volkswagen (VW) worth of market cap to the stock; even permabull Adam Jonas of Morgan Stanley was incredulous:
On March 28th, the day of the announcement of a potential future split, almost $3 billion was spent in options premium on Tesla calls. Here is what the weekly options looked like:
If you go back to the best days table a few pages back, look at the dates of the other two times the market responded exuberantly to a Fed raise: March 2000 and June 2006.
We see parallels between now and the 2000 hike, albeit with some significant differences.
Similarities:
- Strong equity performance in prior year (19% gain)
- Narrow market led by higher valuation companies
- Strong retail inflows
Differences:
- March 2000 hike was fifth in a series of hikes (blue line on the following graph)
- Nominal Fed rate of 6%
- Inflation was not running rampant (2.7% CPI in 1999)
- Lack of significant retail options trading
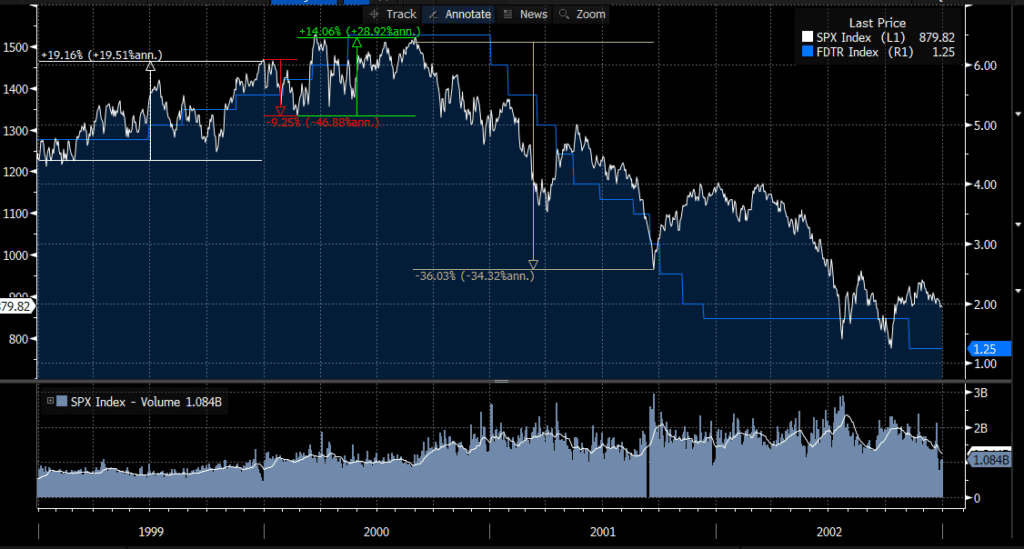
In 1999, the S&P suffered a 9% drawdown in Q1, before making new highs in Q2. The S&P’s maximum drawdown so far in 2022 was almost 13%, but we are a mere 4% below all-time highs currently. Fueled by retail investors, could we see a rally to new highs in Q2? It seems possible.
Surface Pressure
However, much like the strong sister (Luisa), under the surface, pressure is building. To quote the song, “a flaw or a crack, the straw in the stack. That breaks the camel’s back. What breaks the camel’s back?”
What breaks are bond yields. Looking at bond volatility is one lens on risk often ignored. We see a massive divergence between the MOVE index (white line), which measures bond volatility, versus the VIX Index, which measures equity volatility. MOVE is near Ukraine invasion/COVID levels of concern; VIX is tracking toward YTD lows. These types of divergences normally do not persist.
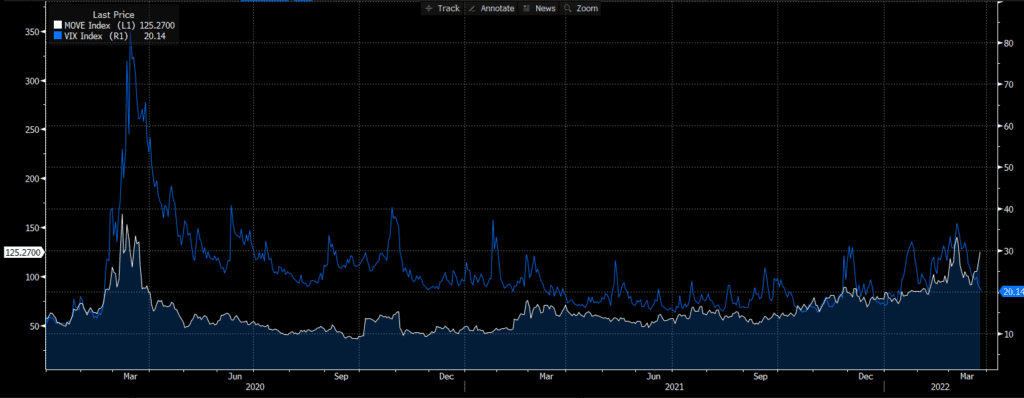
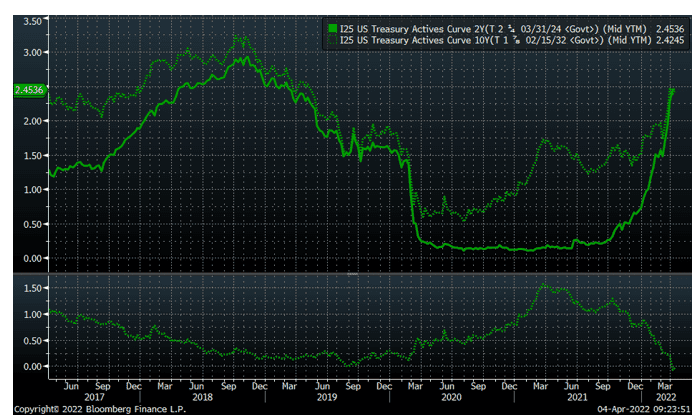
Two things are at play. Short-term rates are rocketing higher in anticipation of the Fed’s nine rate increases; the pace is anticipated to be the fastest in recent history.
Ten-year rates, though moving higher, are not doing so at the same pace. Accordingly, the spread here has gone negative, with the difference between the two-year and 10-year Treasury negative three (3) basis points.
What Else Can I Do?
There are three broad asset classes: stocks, bonds, and cash. The mantra for quite some time has been there is no alternative for equities, given low rates, but investors will eventually ask what else can I do if interest rates for cash and bonds become meaningful.
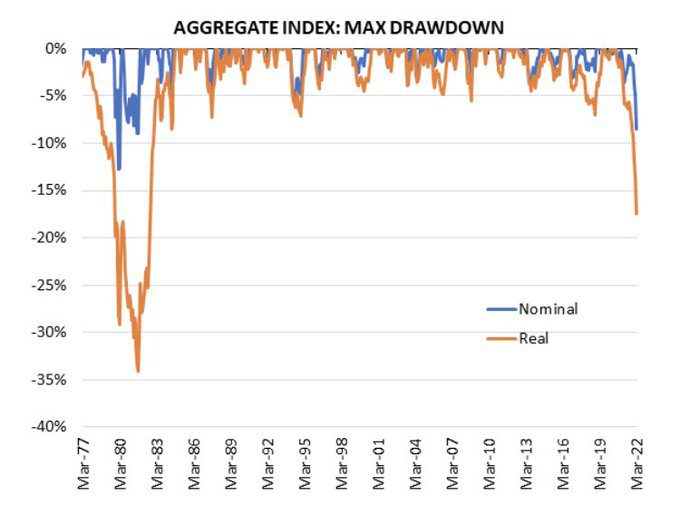
However, in the interim, returns for bonds, considered by many as ballast for equities during a downturn, have been as bad if not worse, and are nearing records for underperformance in both nominal and real (adjusted for inflation) terms:
| Index | 1-Month | 3-Month | 6-Month | 1-Year |
| S&P 500 INDEX | 3.71 | -4.60 | 5.91 | 15.63 |
| Invesco S&P 500 Equal Weight | 2.67 | -2.69 | 6.02 | 12.86 |
| NASDAQ Composite Index | 3.48 | -8.94 | -1.23 | 8.09 |
| Russell 2000 Index | 1.24 | -7.53 | -5.57 | -5.82 |
| MSCI EAFE Index | 0.74 | -5.77 | -3.19 | 1.70 |
| MSCI Emerging Markets Index | -2.25 | -6.99 | -8.11 | -11.13 |
| Bloomberg US Agg Total Return | -2.78 | -5.93 | -5.92 | -4.15 |
| Bloomberg US Treasury Total Re | -3.11 | -5.58 | -5.41 | -3.67 |
Source: Bloomberg (as of most recent month end)
Large cap U.S. equities are the only asset class that has generated meaningful returns over the last 12 months. In Q1, bonds, as measured by the Aggregate Index, returned -6%, worse than large cap equities, as measured by the S&P 500 Index, which fell a little less than 5%.
All of You
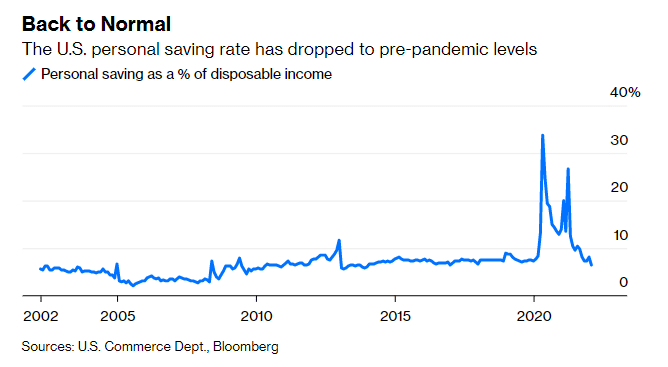
As mentioned in our prior letter, we are about to lap some of the toughest comps in terms of GDP growth and fiscal stimulus, even as inflation puts the pinch on all of you. We have already seen COVID-related savings (much of it from government transfer payments) exhausted, with savings rates back to pre-pandemic levels.
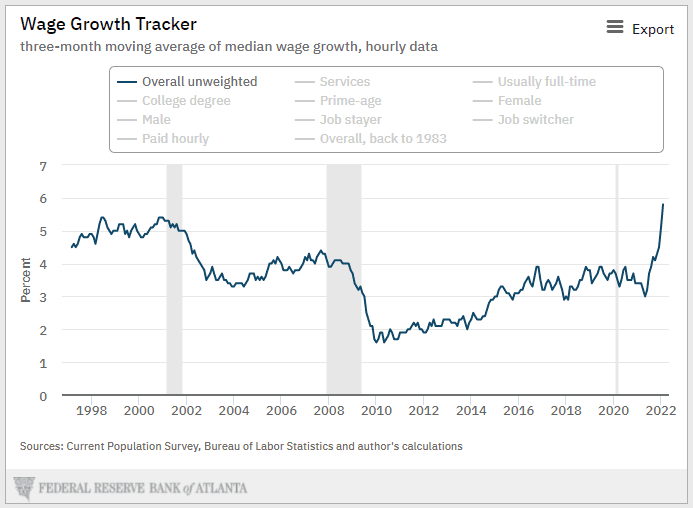
While wage growth has spiked to its highest level in 20 years, it is not keeping pace with inflation.
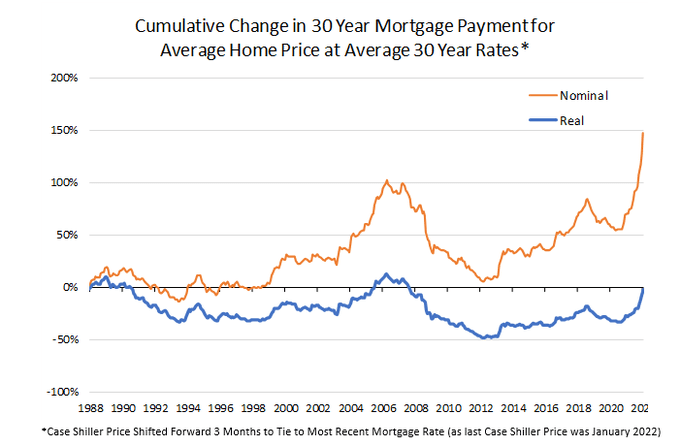
Moreover, we continue to see home prices climb (up 19% year-over-year through January), along with mortgage rates, which are rapidly approaching 5% versus around 3.25% at the start of the year. The monthly payment for the median home has increased 30% in the past year due to the combination of higher prices and higher mortgage rates, although it is just “average” when adjusted for inflation (as of January data, i.e., before rates really spiked).
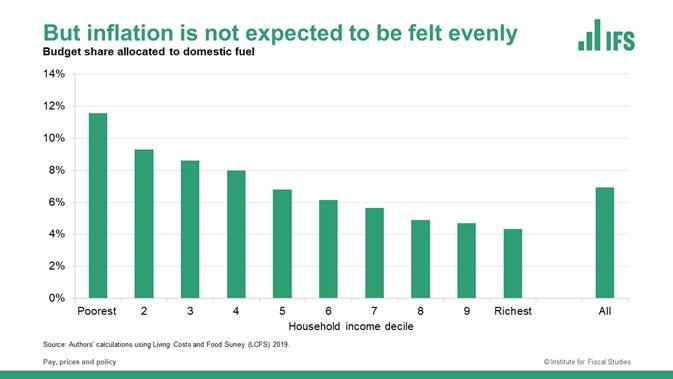
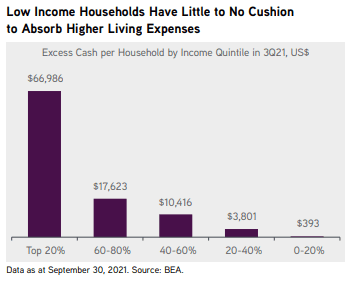
Higher energy prices also are being felt, especially at the lower end of the wage spectrum, where there is little excess cash to absorb higher prices.
Waiting on a Miracle
When writing our last newsletter, the Russian military was on the advance in Ukraine. As we write this one, progress has ground to a halt in the face of stiff resistance, and peace talks have started (again) in Turkey. Given the last round allegedly involved the use of some sort of chemical or biological poisoning as well as the former owner of a professional football team/oligarch, seems like we are waiting on a miracle in terms of a resolution to the conflict.
However, equities, especially megacap tech and meme stocks, are certainly responding enthusiastically to any headline indicating de-escalation. Haven assets like gold are being sold, as is oil, in hopes of a return to normalcy for energy markets. Bonds, especially on the longer end, continue to be bought, driving the curve closer to inversion.
While we are students of things like history and geopolitics, and certainly following these events closely, chasing headlines and narratives, be it at the macro or individual stock level, is a fool’s errand. We continue to be process oriented. At the individual stock level, that means focusing on fundamentals like valuation and growth potential. From a macro perspective, it means looking at both the levels of key inputs (GDP, inflation, the shape of the yield curve, bond spreads, valuation), as well as the likely rate of change of these variables. Lost in the jubilation over headlines is that the levels and rates of change for most of these variables points to the need for caution.
- GDP – Strong for Q4, but we are driving in the rearview mirror here. The math for following quarters reflects almost impossible comps in terms of maintaining the same rate of growth, i.e., growth is likely to slow.
- Inflation – Same as GDP. Mathematically, almost certain to slow, albeit remain at levels high enough to prompt the Fed to continue to bow to the political pressure to do something.
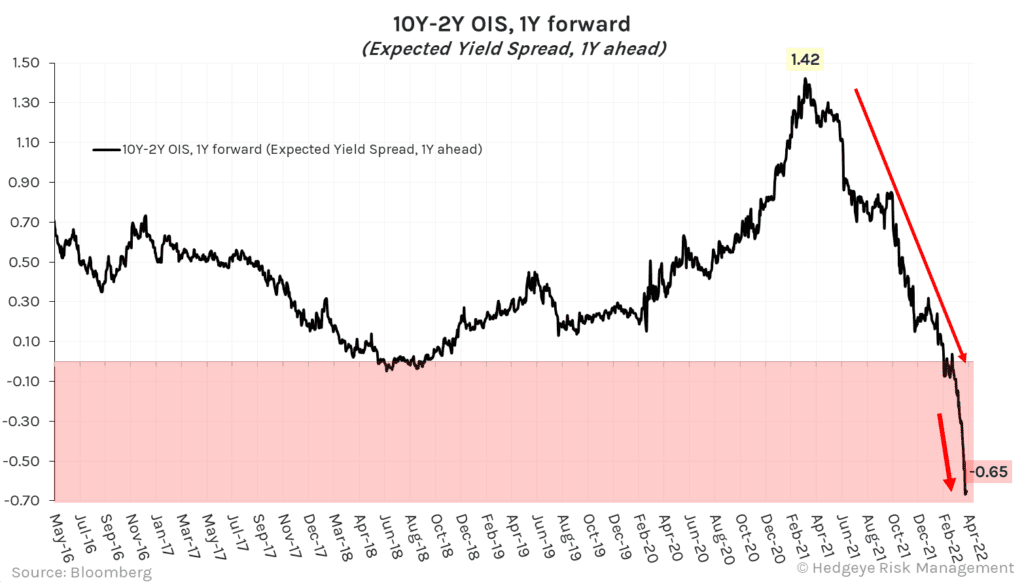
- Shape of the yield curve – Despite the Fed’s protests, it matters. Measures of expectations for the shape of the 10-year minus 2-year spread in a year have cratered, a typical an ominous portent.
- Bond spreads – Credit risk has declined, which is the one positive indicator here.
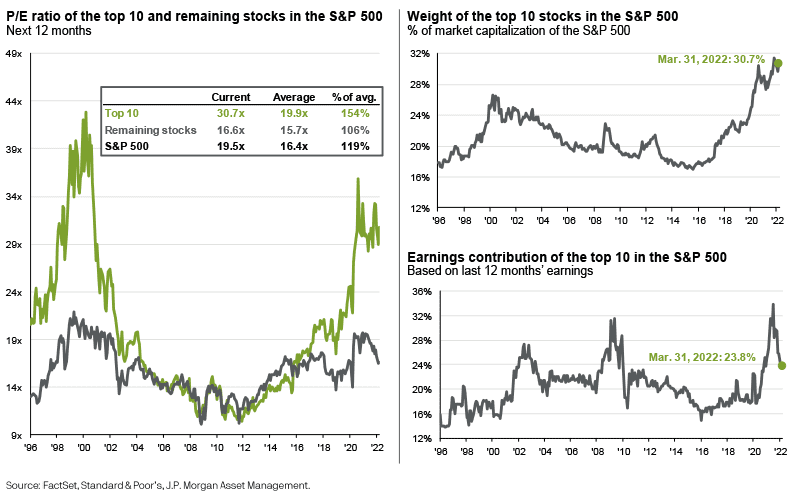
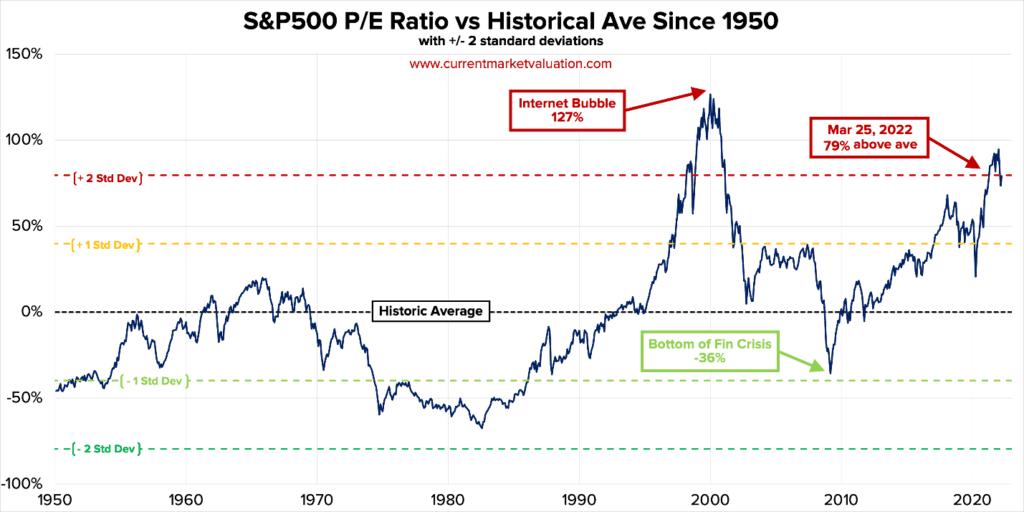
- Valuation – This is the most dangerous variable. Flows are slowing while valuation remain elevated despite the recent “correction.” In particular, the largest ten stocks are the most expensive (Over 30x P/E) and comprise over 30% of the index despite declining contribution to the index’s earnings.
Source: Ruffer
There is an apocryphal Ben Graham quote, “(I)n the short run, the market is a voting machine, but in the long run, it is a weighing machine.” This seems anachronistic now as the market, in the short run, has turned into a casino. In fact, online brokerage Robinhood announced it is adding four (4) additional hours of trading; not much longer until it is 24/7 with some free drinks and second-hand smoke.
We found the following analysis from our friends at Ruffer particularly insightful: “In today’s financial system, flows seem to matter more than fundamentals. A recent study suggests that a one dollar flow into equity markets creates a five dollar price impact. Drivers of flow (stimulus, volatility, past performance and passives) have been mutually reinforcing for at least a decade. So the danger for investors is that, as liquidity support is reduced in response to inflationary pressure, this virtuous dynamic for equity prices could become a vicious one.”
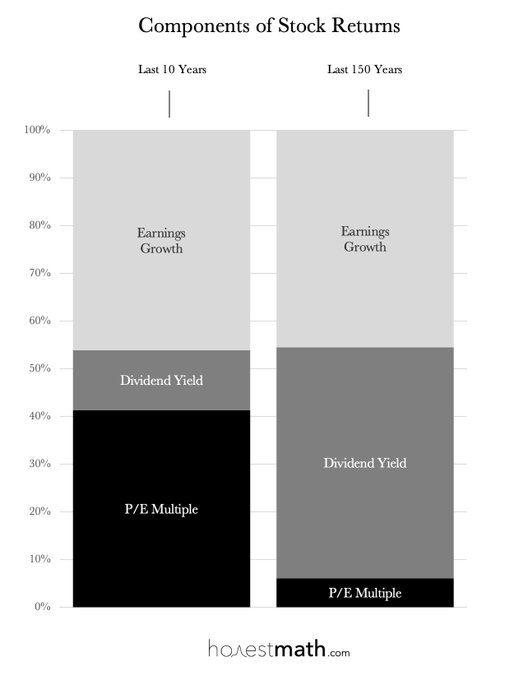
Look no further than this decomposition of returns over the last 10 years versus over the last 150 (take this with as much salt as possible, given the antiquity of the data). Our opinion is that the next ten years is more likely to look like the long-term history (driven by earnings and dividends) as opposed to the last 10 (driven by multiple expansion).
Encanto ends with the central character, Mirabel, the one non-magical family member, helping bring the family together to rebuild their enchanted home, which collapsed as the miracle lost its power. The miraculous returns for markets, post-Covid, has been driven, in part, by accommodative central bank policy. That accommodation is anticipated to end.
Markets started to show cracks in February but rebounded in March, despite a rate hike and more hawkish language. Whether this market reprieve was temporary or permanent remains to be seen. We are inclined to play more defense than offense at present, focusing on high quality and lower valuation as opposed to chasing retail favorites and broad market indices higher.
READY TO TALK?