

August Update: Everything’s Coming Up Milhouse
Investors felt a little like Milhouse in July because despite a deluge of bad economic and inflation data, equity markets still posted strong returns. We will look at both the news flow and the market’s reaction; and where it might all go from here in this Milhouse-inspired update.

How could this happen? We started out like Romeo and Juliet, but it ended up in tragedy!
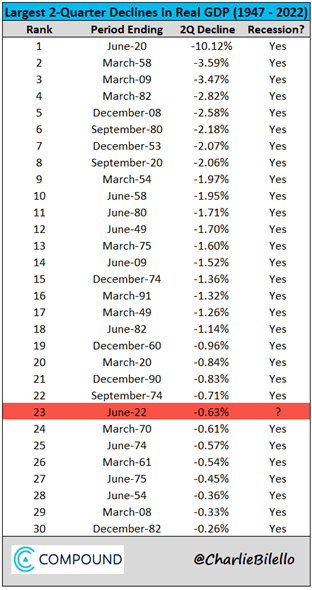
Headlines made for tragic reading in July. Inflation leapt to 9.1%, the highest in recent memory. Real GDP was negative for a second consecutive quarter, which, though not the official definition of a recession, is certainly unwelcome and, historically, has preceded a recession 100% of the time.
Elevated inflation prompted the Federal Reserve to once again, increase short-term interest rates, this time by 75 basis points. This brought the total number of increases for 2022 to nine (9), with the Federal Funds rate now at 2.25%.
While such hawkishness would typically be enough to spook investors, comments made by Chair Powell gave investors hope of an imminent pivot toward a more accommodative Fed; specifically, it was this sentence: “(A)s the stance of monetary policy tightens further, it likely will become appropriate to slow the pace of increases while we assess how our cumulative policy adjustments are affecting the economy and inflation.”
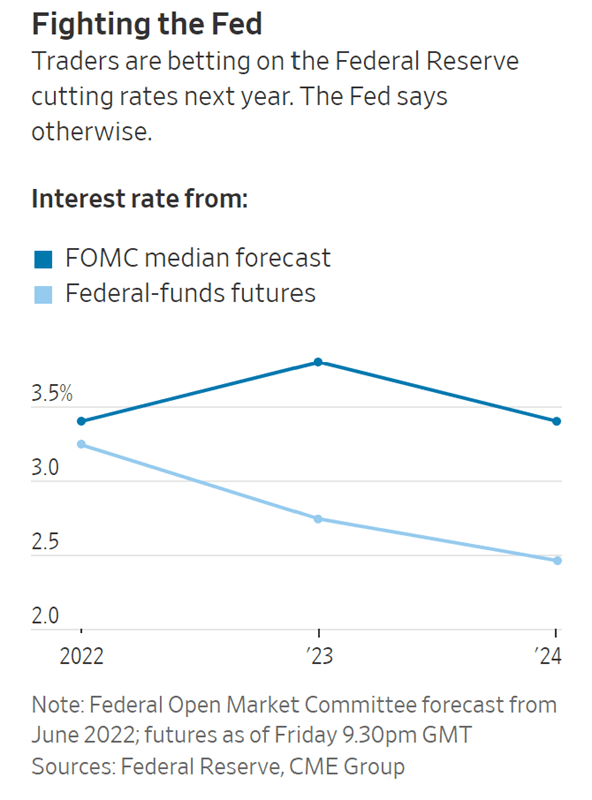
This served to lead investors to conclude that not only would the pace of increases slow but also that the Fed would start decreasing rates next year. As this excerpt from the FT states, this is “entirely unprecedented.”
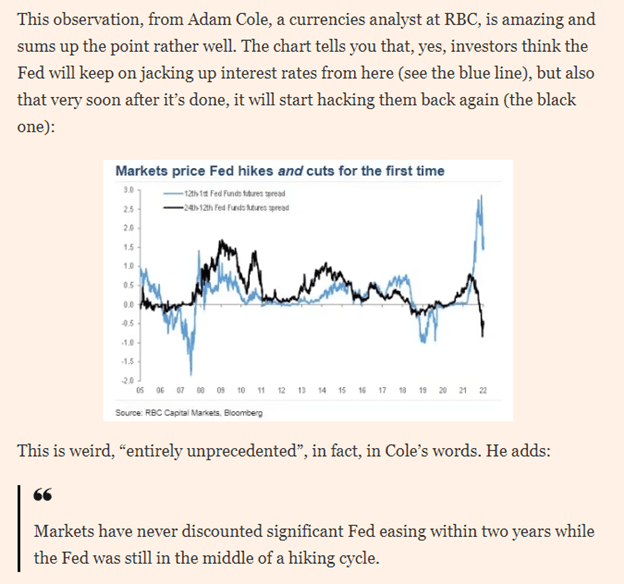
To put it a little clearer, the current Fed funds rate is 2.25%. It is widely anticipated the rate will be increased by 0.75% in September. Let us be conservative and say the Fed stops there (its own estimates call for a rate closer to 3.5%). Fed funds futures (what the market expects rates to be) anticipate rates falling back to 2.5%. What could the reasons be? One, inflation is transitory (thought we retired that) and rapidly retreats to the Fed’s 2% target. Two, a recession forces the Fed to cut rates.
This aberrant market behavior has served to, once again, invert the key 10-Year/2-Year Treasury curve, one of the key indicators we follow in terms of indicating the likelihood of an economic contraction:
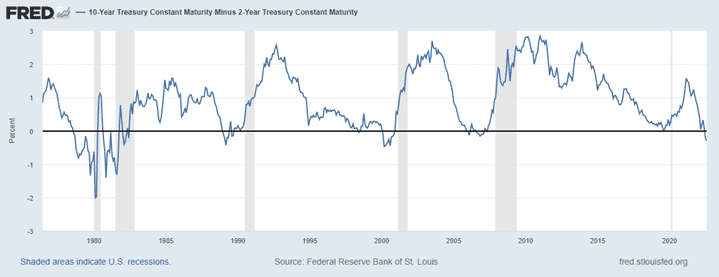
The current reading of -31 basis points is the largest inversion since the tech bubble of 2000, when it reached -51 basis points. Prior to that, the low was -200 basis points in 1980. As the gray bars in the above chart show, this behavior by bonds has historically predicted recessions.
I’ll be batting .352 in the majors!

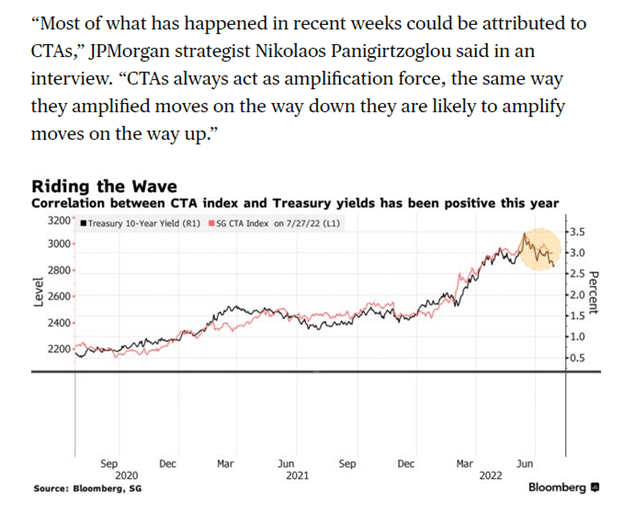
Undaunted and overconfident, investors piled into stocks in July. To be fair, on the heels of the worst first half in 50 years, there were technical reasons for the bounce. Markets were technically oversold and systematic investors were underweight equities. Moreover, CTAs, which are often trend following funds, jumped into equities, too.
| Index | 1-Month | 3-Month | YTD | 1-Year |
| S&P 500 INDEX | 9.22 | 0.38 | -12.59 | -4.66 |
| Invesco S&P 500 Equal Weight E | 8.65 | -0.57 | -9.54 | -2.93 |
| NASDAQ Composite Index | 12.39 | 0.69 | -20.45 | -14.92 |
| Russell 2000 Index | 10.44 | 1.49 | -15.45 | -14.34 |
| MSCI EAFE Index | 5.04 | -3.84 | -15.15 | -13.75 |
| MSCI Emerging Markets Index | -0.17 | -6.33 | -17.68 | -19.82 |
| Bloomberg US Agg Total Return | 2.44 | 1.49 | -8.16 | -9.12 |
| Bloomberg US Treasury Total Re | 1.59 | 0.88 | -7.69 | -8.69 |
Source: Bloomberg (as of most recent month end)
From our perspective, market participants remain firmly convinced that there is a Fed put, i.e., a market level below which the Fed will effectively provide support by providing liquidity. While this phenomenon has been true for most of recent memory (think back to the December 2018 pivot) we are unconvinced that against the backdrop of 9% inflation that this put is still in place. However, in July markets certainly reacted as if it was.
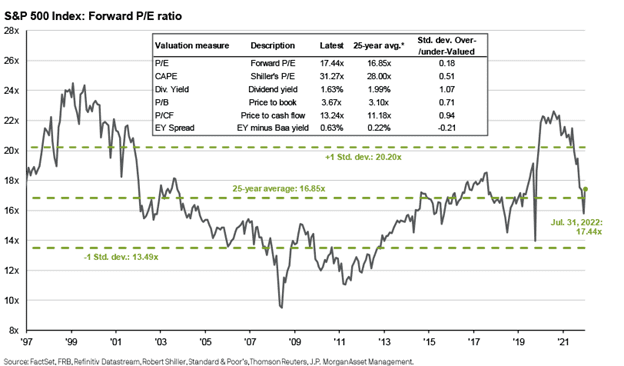
From a valuation perspective, one could argue that valuations became reasonable, if we define reasonable as in-line with historical averages, and for the S&P 500.
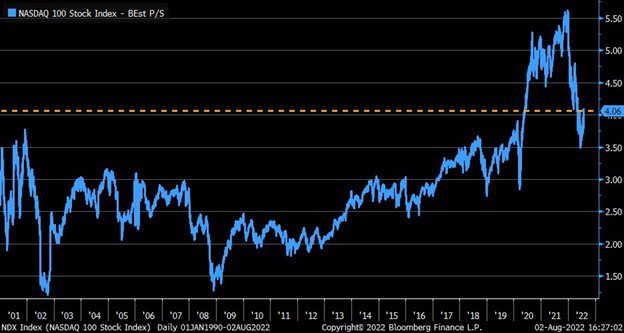
The NASDAQ, on the other hand, though cheaper than it was earlier in the year, remains at a price/sales ratio in the stratosphere.
This is our life now Milhouse, we’re dumpster folk!
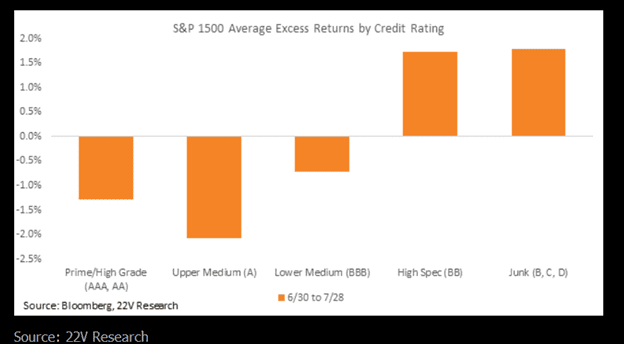
The dumpster folk were the winners from an investment perspective in July. Stocks rated Junk or Highly Speculative by S&P in terms of credit risk outperformed by a wide margin, typically indicative of violent short squeeze.
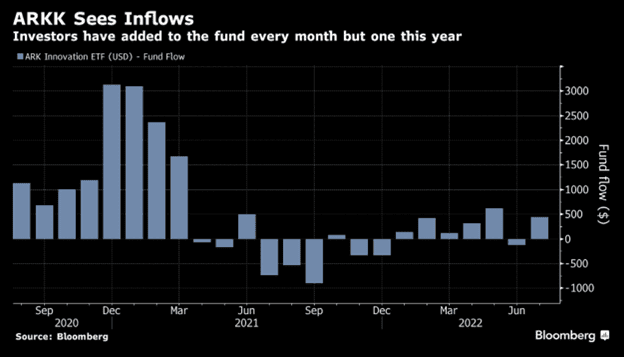
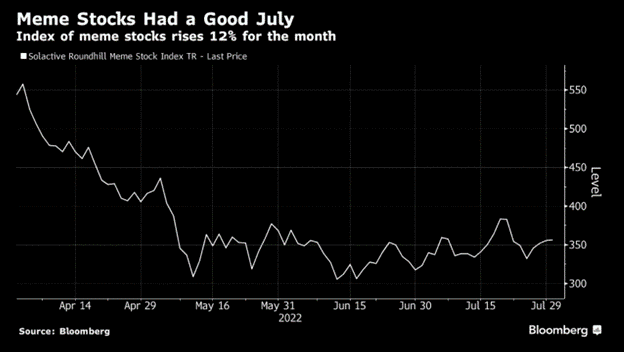
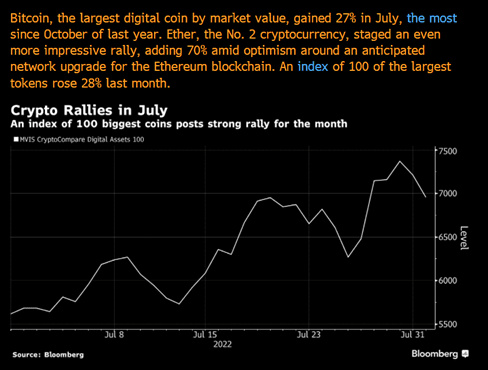
Other outperformers that we would include under the broad umbrella of highly speculative “investments” were meme stocks, ARKK, and cryptocurrencies, many of which are today’s version of ALF pogs. We do not view this type of behavior as indicative of a healthy market.
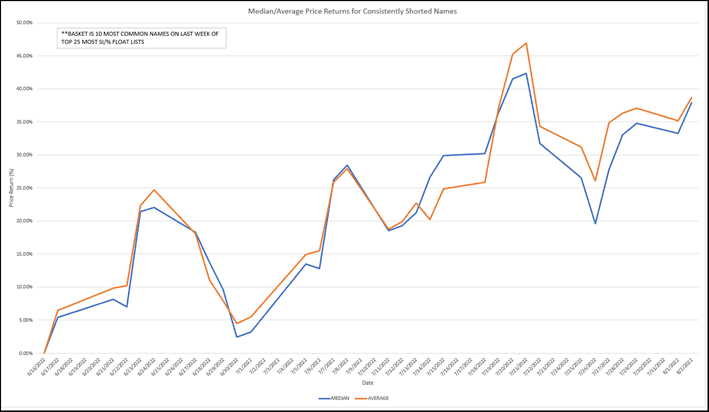
Our friends at BGC ran a study for us showing the performance of the most highly shorted stocks since the market’s interim nadir on June 16; the most highly shorted companies have, on average, gained close to 40% over a six-week period. Similarly, profitless tech companies are up approximately 35% over this period and 12% during the first three (3) days of August.
Not only am I not learning, I’m forgetting stuff I used to know.
What are investors forgetting here?
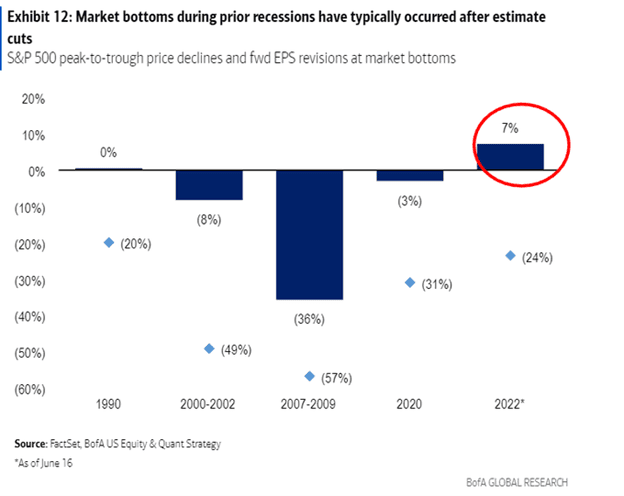
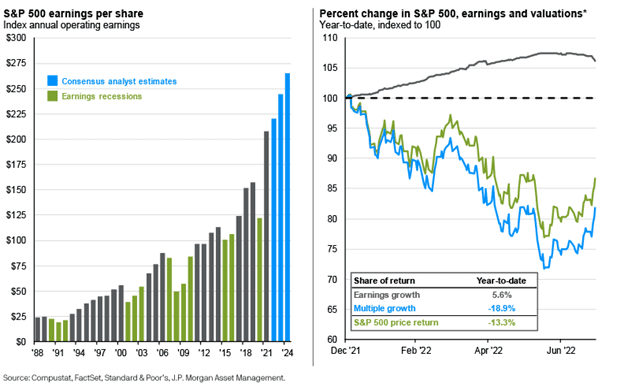
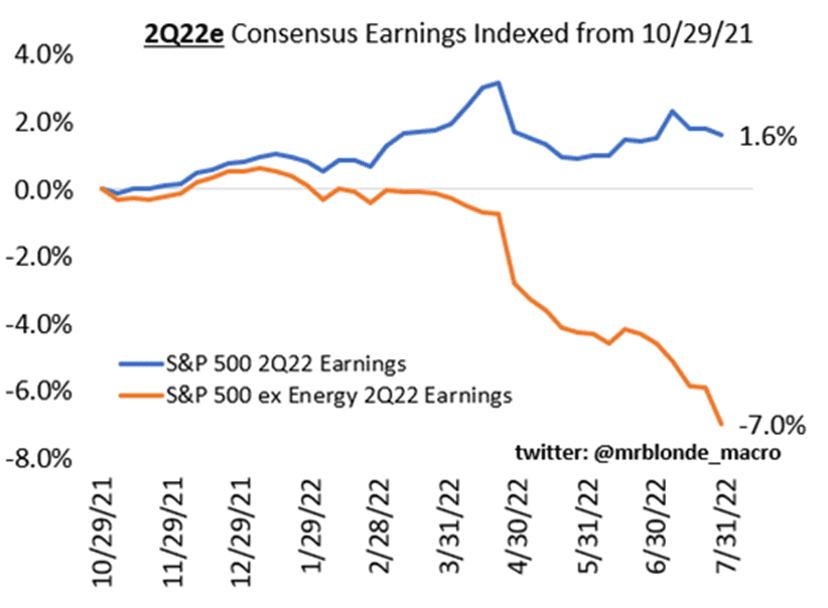
One is that earnings matter. Have multiples on the market compressed to the point where valuations are reasonable? Yes, assuming earnings do not decline. Do earnings typically decline in a recession? Yes. That decline in earnings is not (currently) being anticipated according to analyst estimates, and Q2 is off to a rocky start, especially if energy is excluded.
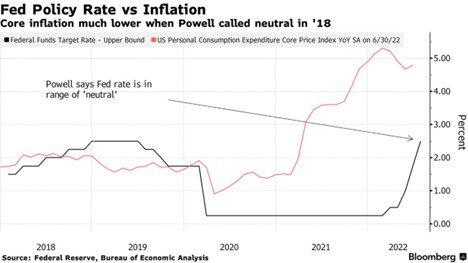
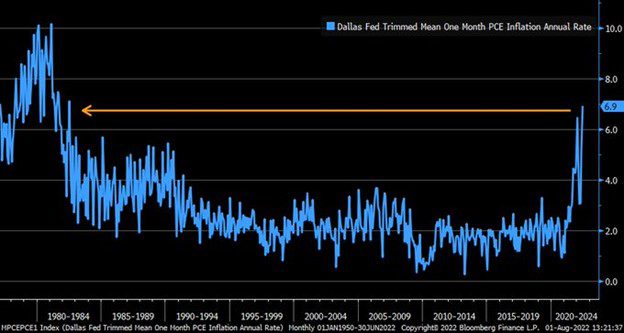
Two is that inflation matters. We remain convinced that the Fed is under immense pressure to show it is doing something to fight inflation. PCE inflation, a primary metric used by the Fed, is at levels last seen in the early 1980s. In looking at the chart, this series appears to be more trend following than mean reverting, meaning elevated readings could be in store for a while. With the Fed’s target at 2%, future rates cuts seem hopeful. Also, that neutral call in 2018 was when inflation was 2%.
Digging behind the inflation numbers paints a worse picture. For those who want to delve into the weeds, this is a great resource. For those who want the big picture, here you go (all figures reflect July’s reading, which is data as of June 30):
- Food and energy inflation running over 20%; this was before the decline in petroleum prices.
- Core goods inflation fell (a positive) but remain over 6%; this is the supply chain loosening.
- Services accelerated to over 5% inflation.
- Rents also inflated over 5%.
- Over 20% of the CPI components inflated by more than 10% year over year, with over 70%
Inflating by more than 5%; this is widespread.
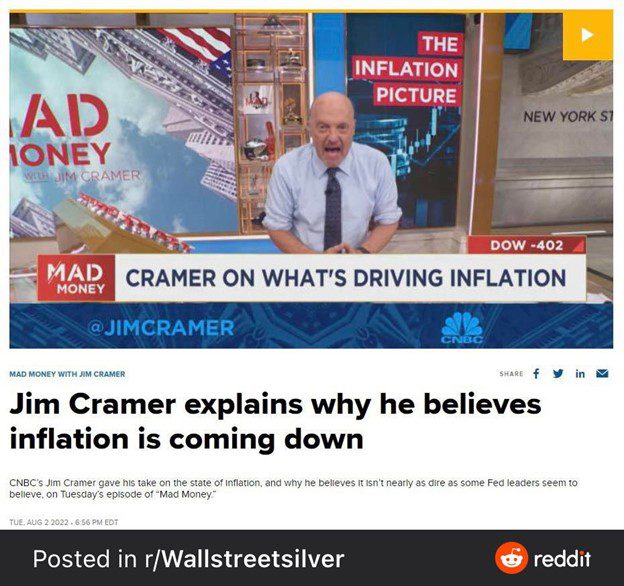
While we have seen some recent data points showing slowing producer price inflation, this is the most damning evidence for inflation not yet to have peaked:
I’m not a nerd, Bart. Nerds are smart.
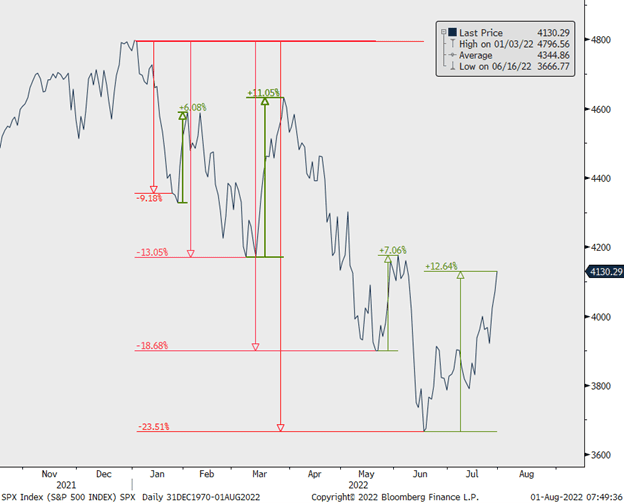
Nerds tend to be aware of history. The recent rebound we have seen is the third we have had so far this year, and at over 13% on the S&P 500 and almost 19% on the NASDAQ (we are one good day from a new bull market in highly valued tech stocks) is the strongest so far.
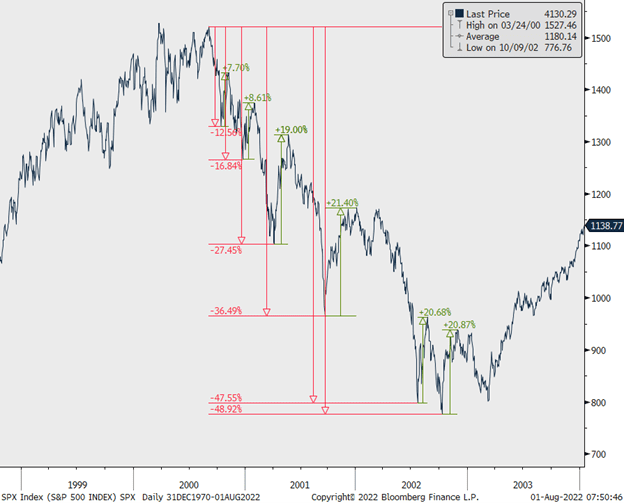
Unfortunately, looking at the history of the tech bubble paints an eerily similar picture.
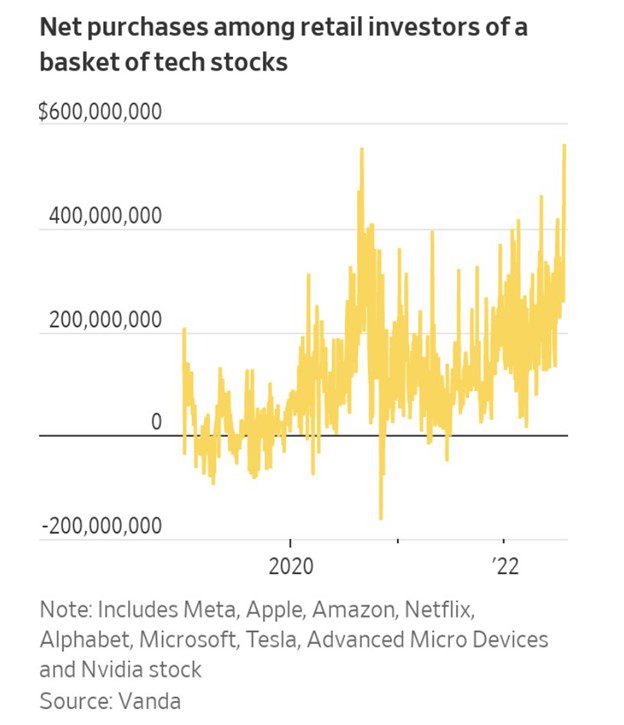
Nerds, at least the smart ones, know what they do not know. Fundamentally, a continued rally, especially among the most highly valued stocks, makes little sense, but we do not know how much higher technicals and sentiment can take us. The NASDAQ tallied a 35% gain after its first major decline in 2020, and retail investors are revisiting their favorite tech stocks at record levels. To put it bluntly, retail investors, though they may look smart (like Milhouse) over short periods of time, are generally not.
I say ‘radical.‘That’s my thing that I say. I feel like I’m gonna explode here.
We are seeing radical behavior by consumers, some of which seems like it will inevitably explode.

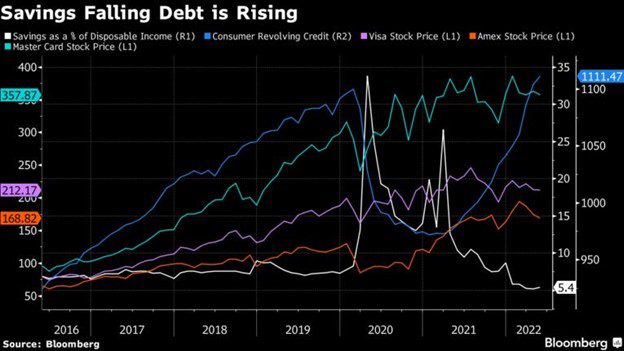
Covid stimulus buffers are being depleted, with savings rates plummeting (white line) and revolving credit, e.g., credit card debt (blue line), increasing. Between April and June, Americans opened 233 million new credit card accounts, the highest reading since 2008. Credit card debt increased by $46 billion during this time, a 13% increase and the largest jump in 20 years. On the positive side, credit card balances have not yet reached pre-Covid levels.
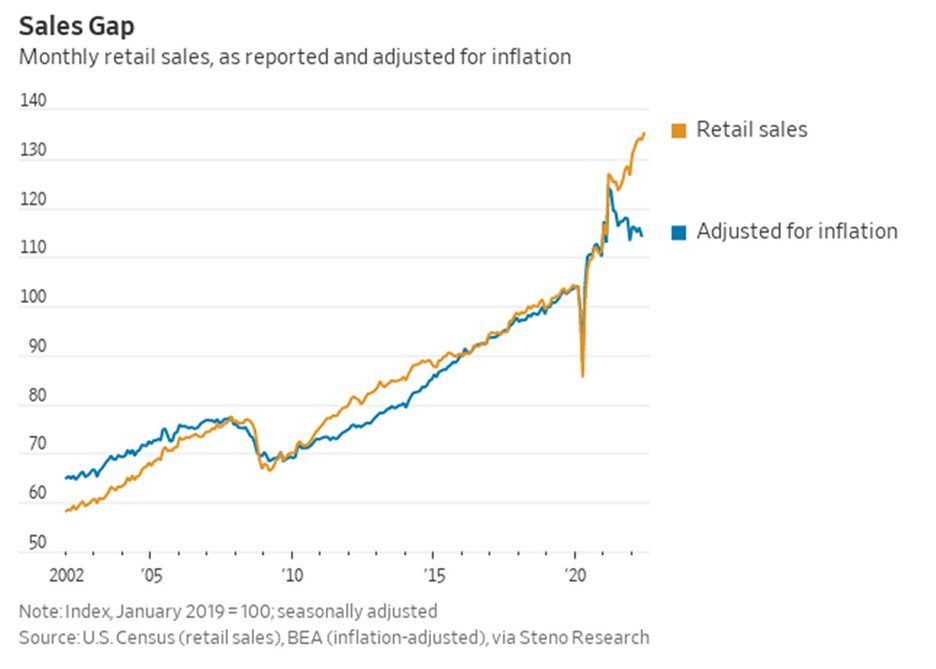
While retail sales superficially look strong, adjusted for inflation they are declining.
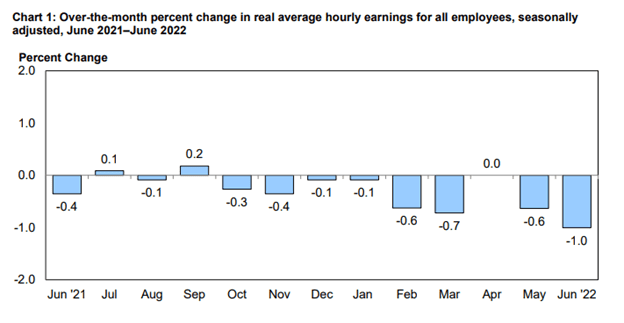
Similarly, while higher wages have received headlines, real wages are, in fact, declining. The math for June (the most recent reading) had wages increase 0.3% for the month while inflation was 1.3%. Over the last 12 months, average weekly earnings for employees have increased 4.2% in nominal terms while real wages have declined 4.4%.
From my perspective, the biggest divergence we have seen in the equity market is the one between surveys (how investors feel) and positioning (what they are doing). The irony is that I am widely regarded as someone without feelings, which is only 99% true. Accordingly, we believe what investors are doing is more indicative, and we have not seen positioning that would typically be the end of a market decline; current equity allocation per BofA at 62% is below the recent 66% peak, but above the average of around 56% and well above most prior troughs.
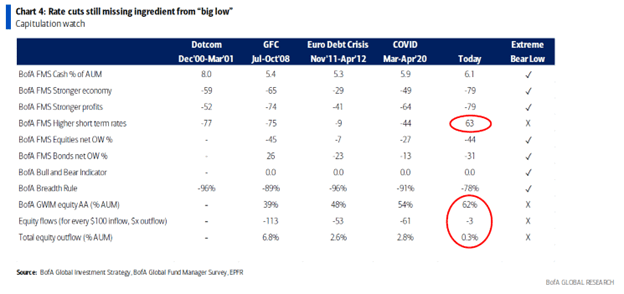
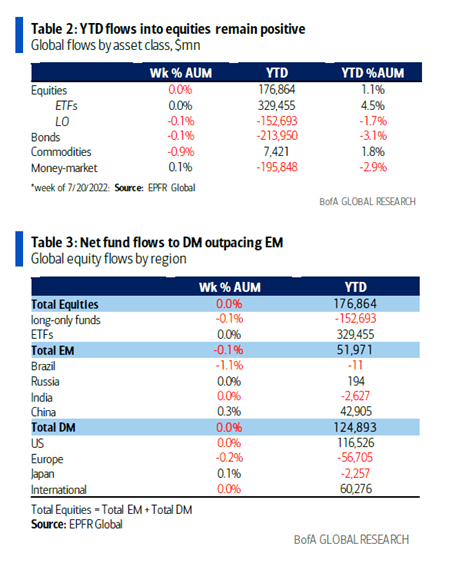
Similarly, equities have seen net inflows year-to-date. Outflows per $100 of inflows have been a paltry $3 versus prior lows of $61 during the Covid meltdown, $53 in 2011, and $113 in the financial crisis.
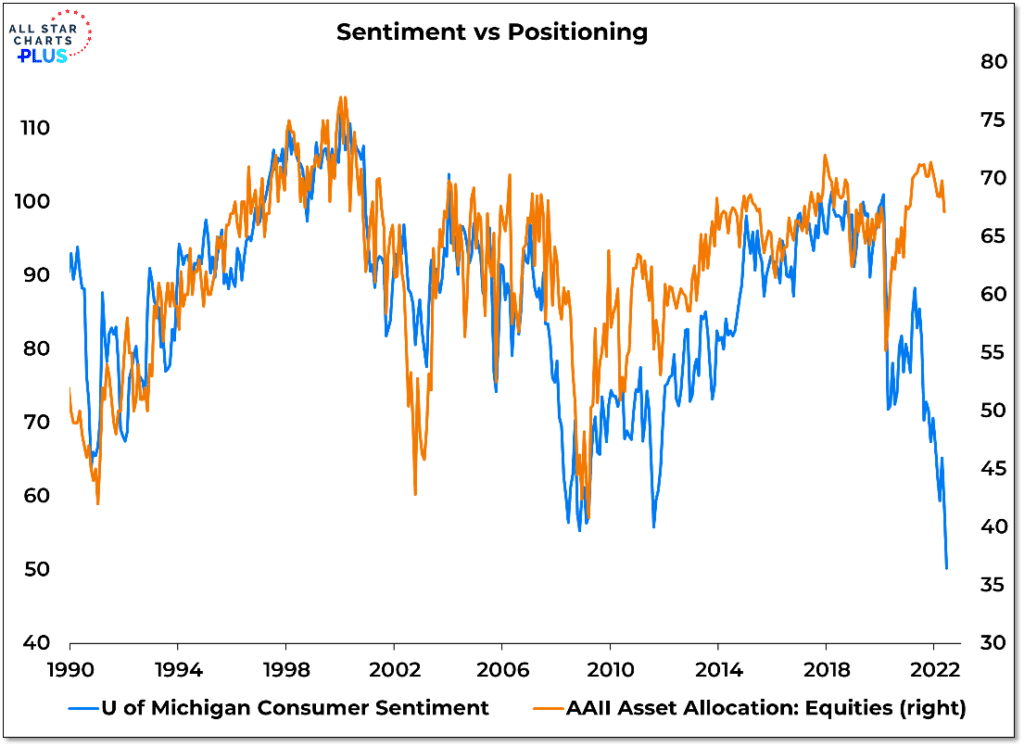
The oft-maligned Michigan Sentiment Survey shows a similar divergence with equity positioning; the more important metric here is the orange line, equity allocation, which confirms the BofA data on the relatively high allocation to equities:
This is one of the most challenging market environments we have faced, given the divergences between:
- Sentiment and fundamentals
- Near-term fed hawkishness and an anticipation (perhaps unwarranted) of medium-term dovishness
- High inflation (but perhaps unsustainable).
Because of the capricious nature of feelings, not to mention their ability to drive us to sub-optimal decisions, we remain focused on our process. The key metrics (shape of the yield curve, high yield spreads, inflation and growth expectations) we use continue to indicate caution is warranted. Accordingly, we are holding a little more cash and emphasizing higher quality companies with pricing power and what we believe to be attractive valuations. We believe investors chasing the recent FOMO-driven rally in highly shorted and/or highly valued stocks are like Kirk van Houten, overconfident in their abilities and likely to be left with a broken demo tape and thawing hotdogs in a gas station sink.

READY TO TALK?