

March 2023 Update: Field Trip
I recently accompanied my son’s class on a field trip to something called the Exploreum. As you may have heard, good things don’t end with “eum”. Although certain facets of the trip were quasi-educational, I did take umbrage at their comparison of “playing the stock market” to casinos and the lottery:

Setting aside this disinformation, which is likely to prompt a letter to the curators, we will use the field trip as our inspiration for this month’s recap and outlook:
Key Takeaways
- After a bounce to start the year, most assets retreated in February, though remain up for now.
- Hotter than expected economic readings, including inflation, caused investors to question the timing of the much anticipated Fed “pivot”.
- We maintain our outlook for a challenging rest of 2023 for market indices, but find opportunities at the individual stock level.
February Recap
The mania that engulfed markets in January receded in February, albeit only slightly. Just as we saw in 2022, all major asset classes suffered losses, though, strangely, some riskier assets (e.g., small caps and the tech-heavy NASDAQ) declined less than large cap stocks, not to mention bonds:
| Index | 1-Month | 3-Month | YTD | 1-Year |
| S&P 500 INDEX | -2.45 | -2.30 | 3.68 | -7.72 |
| NASDAQ Composite Index | -1.00 | 0.12 | 9.61 | -15.93 |
| Russell 2000 Index | -1.69 | 0.88 | 7.89 | -6.04 |
| MSCI EAFE Index | -2.06 | 6.00 | 5.89 | -2.55 |
| MSCI Emerging Markets Index | -6.48 | -0.46 | 0.91 | -14.97 |
| Bloomberg US Treasury Total Re | -2.34 | -0.41 | 0.11 | -10.08 |
| Bloomberg US Agg Total Return | -2.59 | -0.04 | 0.41 | -9.72 |
| Invesco DB Commodity Index Tra | -4.46 | -6.22 | -3.61 | 0.14 |
Source: Bloomberg (as of most recent month end)
The reason for the decline? Better than expected figures in terms of employment and higher than expected inflation readings have dampened hopes for the much-discussed Fed pivot. As we have argued over the last few months, we believed these hopes were just wishful thinking, and market expectations for rates now are assuming more increases from the Fed.
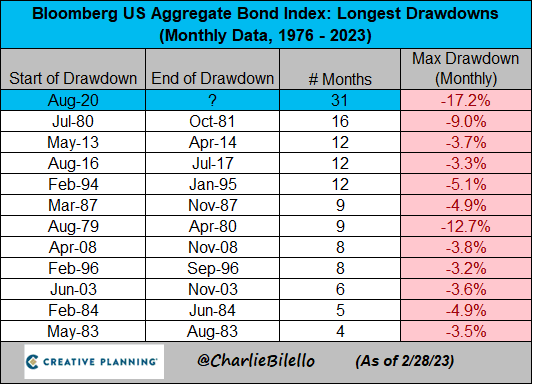
The result of the Fed’s more aggressive stance has been an unprecedented (well, at least since 1976) decline in bonds, both in terms of magnitude and duration (no pun intended):
March Outlook
I liked this sign. Unfortunately, there was not an adjacent exhibit to teach the children anything about probabilities, that is a subject in desperate need of more attention.

As investors, we think in probabilities; the possibilities, as the cliché goes, are endless, and it is virtually impossible to manage around them.
From a probability perspective, this chart shows how we are thinking about key market factors based on our analytical process:
| More Negative | Neutral | More Positive | |||
| Inflation | ← | ||||
| GDP Growth | ≈ | ||||
| Fed Policy | ≈ | ||||
| Interest Rates | ← | ||||
| Credit Spreads | ≈ | ||||
| Stock Multiples | ≈ | ||||
| Earnings Growth | ≈ | ||||
| Deteriorating | ← | ||||
| Status Quo | ≈ | ||||
| Improving | → | ||||
Let’s examine each factor briefly.
- Inflation – Negative and worsening. Virtually every inflation metric since what we have dubbed the Fed’s “disinflation” meeting/press conference in early February has gone in the wrong direction. While the housing components segment of services is likely to cool, wages are looking problematic:
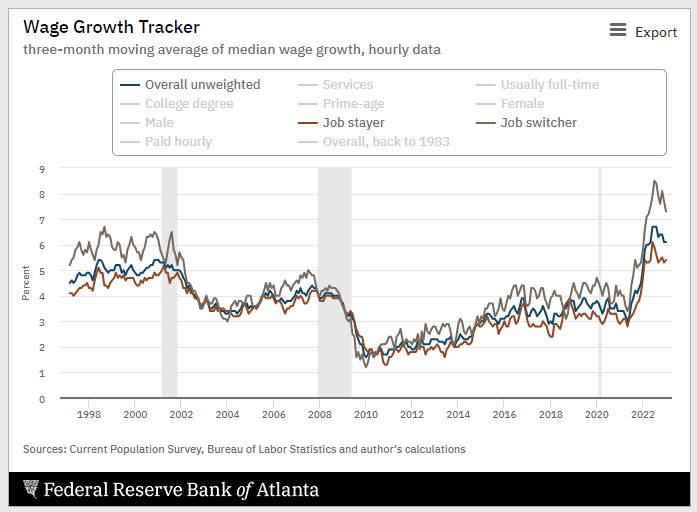
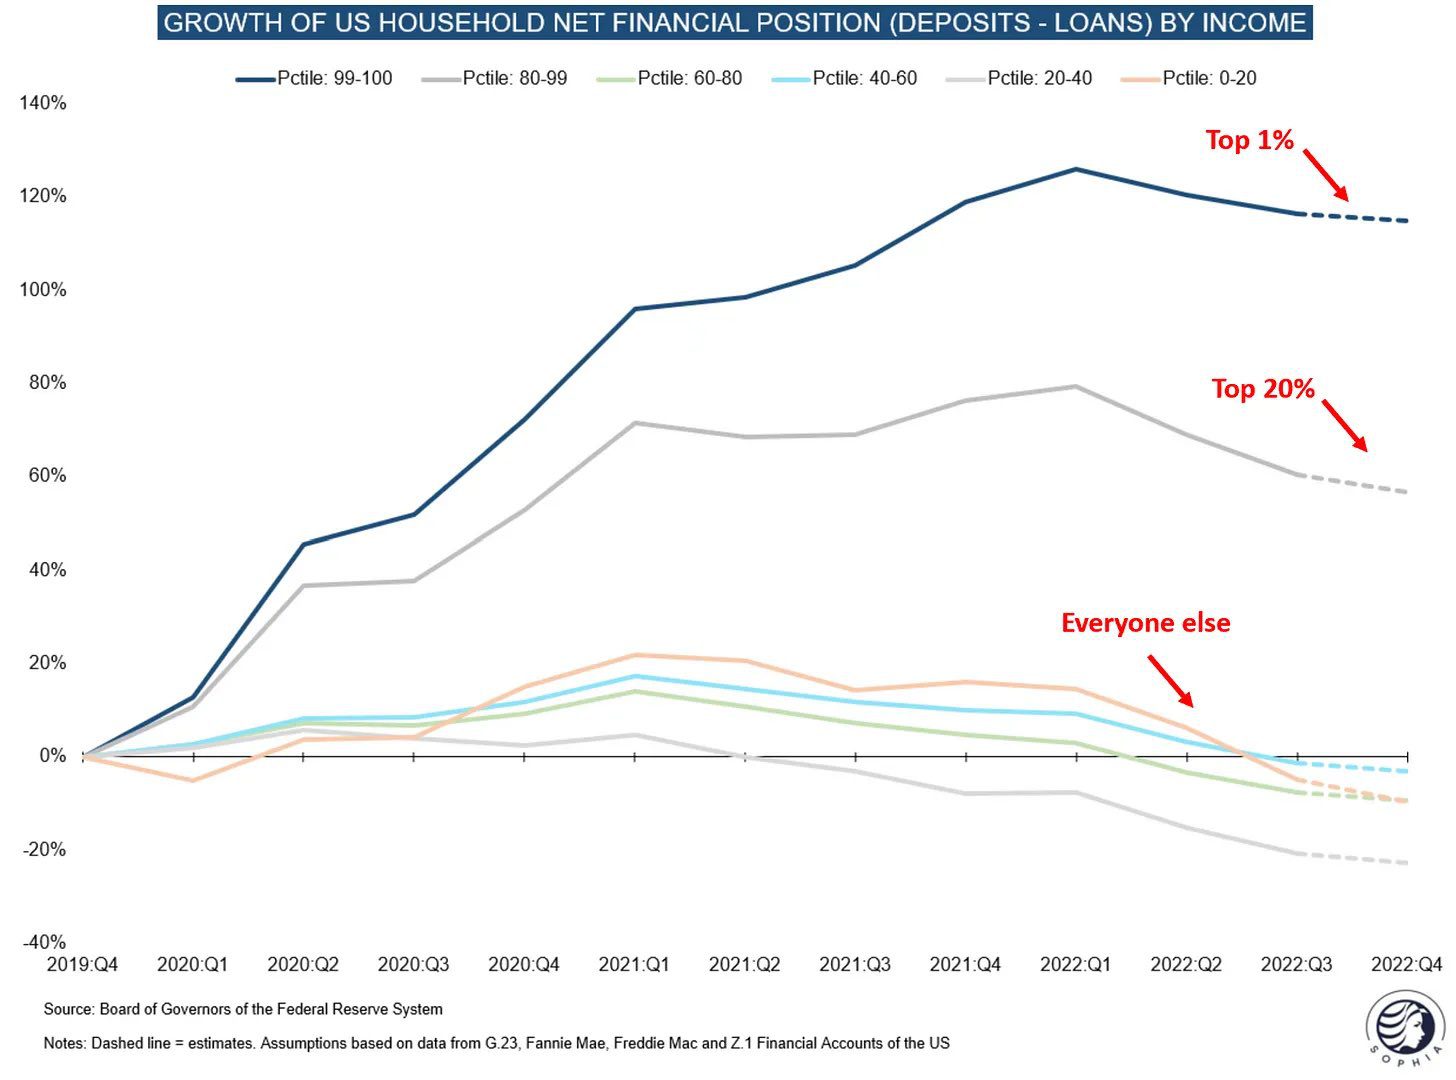
We are now seeing a bifurcation between the haves and have-nots, with excess post-Covid savings exhausted for lower income cohorts but bountiful at higher income levels. Whether this savings exhaustion is enough to arrest inflation remains to be seen.
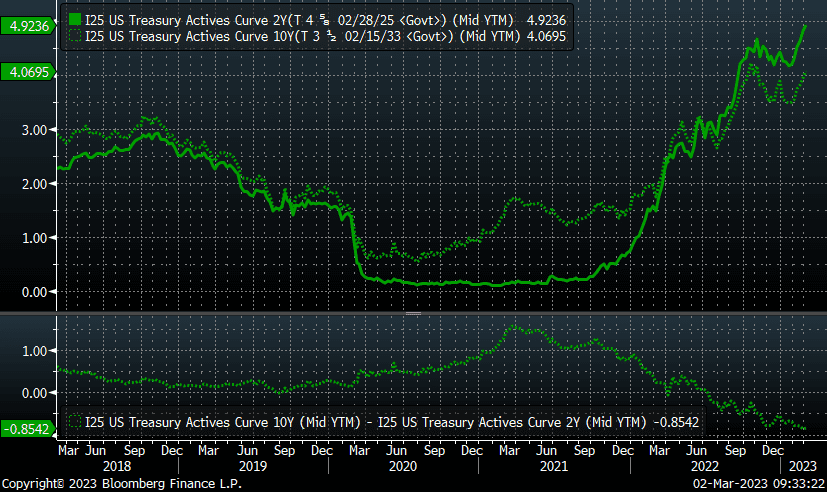
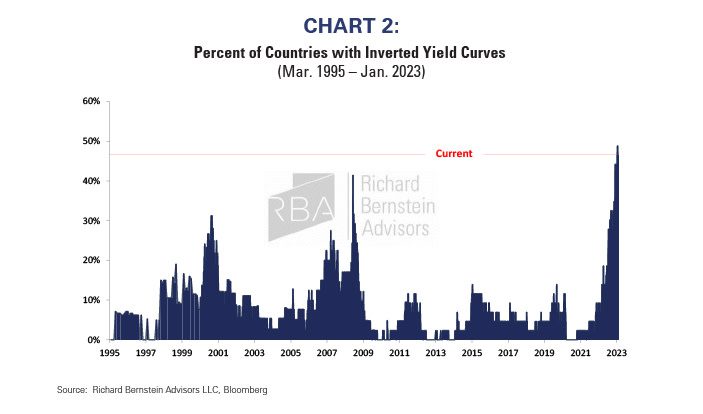
- GDP Growth – Negative but stable. The inversion of the 10-2 curve slightly worsened to 0.85%, which typically coincides with poor GDP growth and/or a recession:
The story is much the same globally:
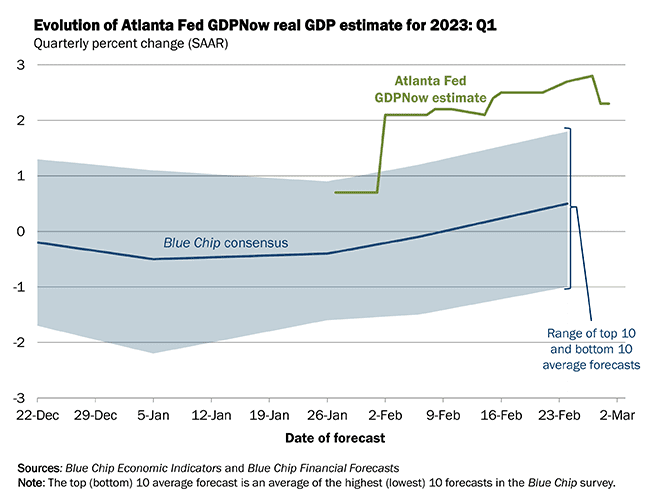
However, the Fed is projecting domestic growth while forecasters are looking for a modest decline in GDP in spite of strong data points so far this year:
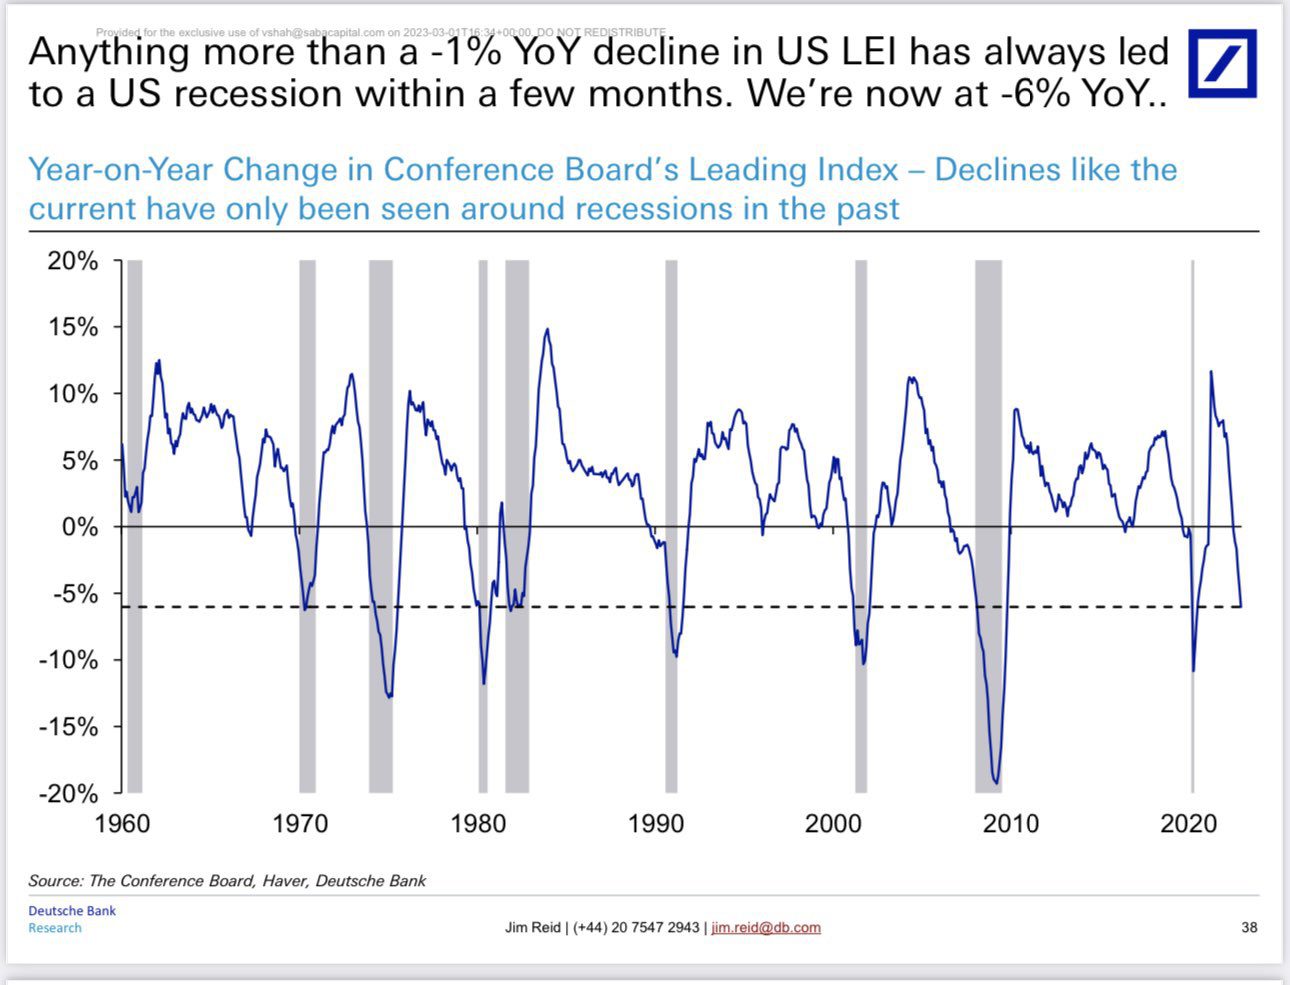
Leading economic indicators paint a dour picture as well:
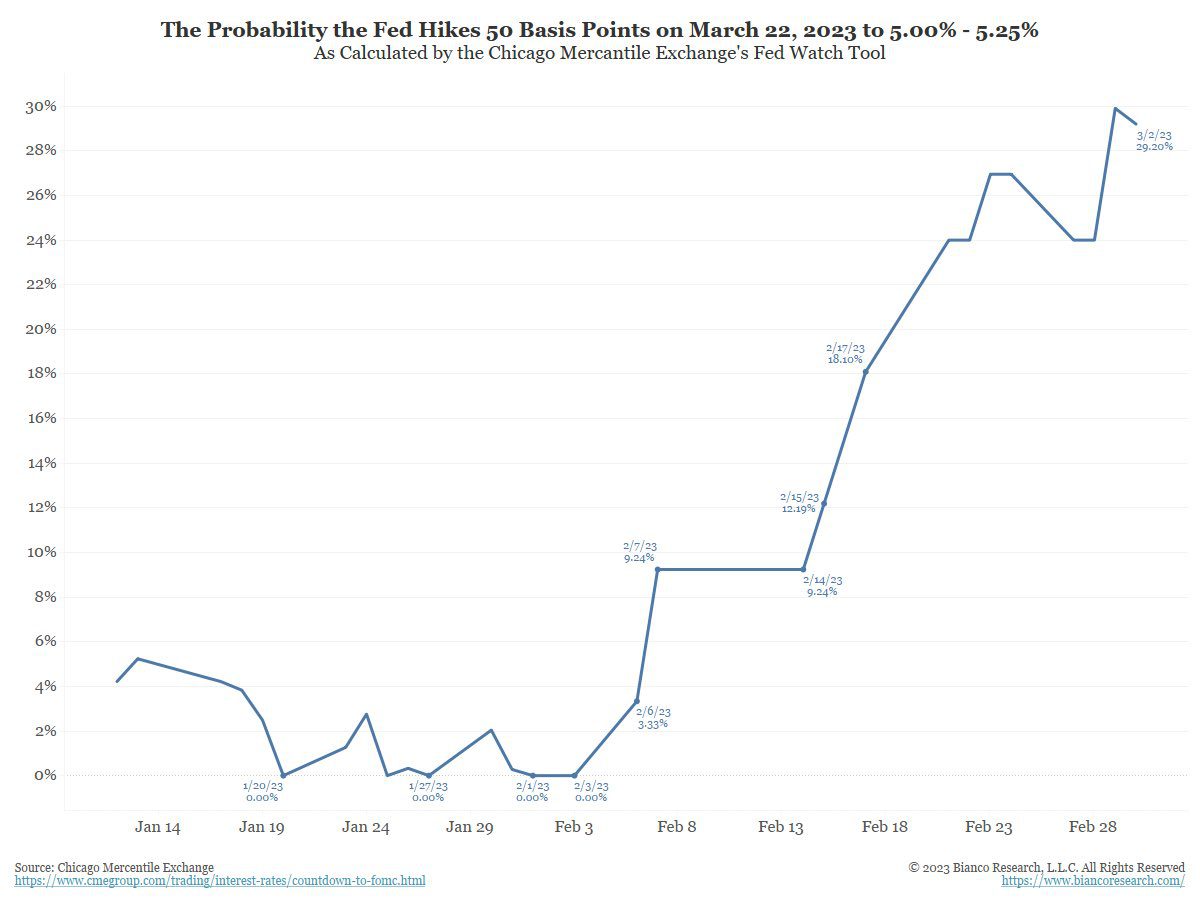
- Fed Policy – Negative but stable. The market has started to come around to our view, with the projected peak rate increasing and peak date extending. Conjecture now is how aggressive the Fed will be this month; 25 basis points was the consensus after the Fed’s February meeting, with around a 0.3% chance of 50 basis points. Since then, at least three Fed officials have put 50 basis points on the table, and the odds of such a hike from a market perspective are now at 29%. This would reflect a reacceleration of restrictive policy, and a tacit admission that the reduction to 25 basis points in February was premature:
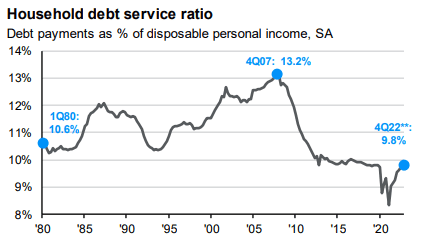
- Interest rates – Negative and worsening. With the 10-year Treasury back above 4% and mortgage rates hovering near 7%, interest rates are not helpful. And while personal interest outlays are up 42% since the end of 2021, they remain near pre-Covid levels:
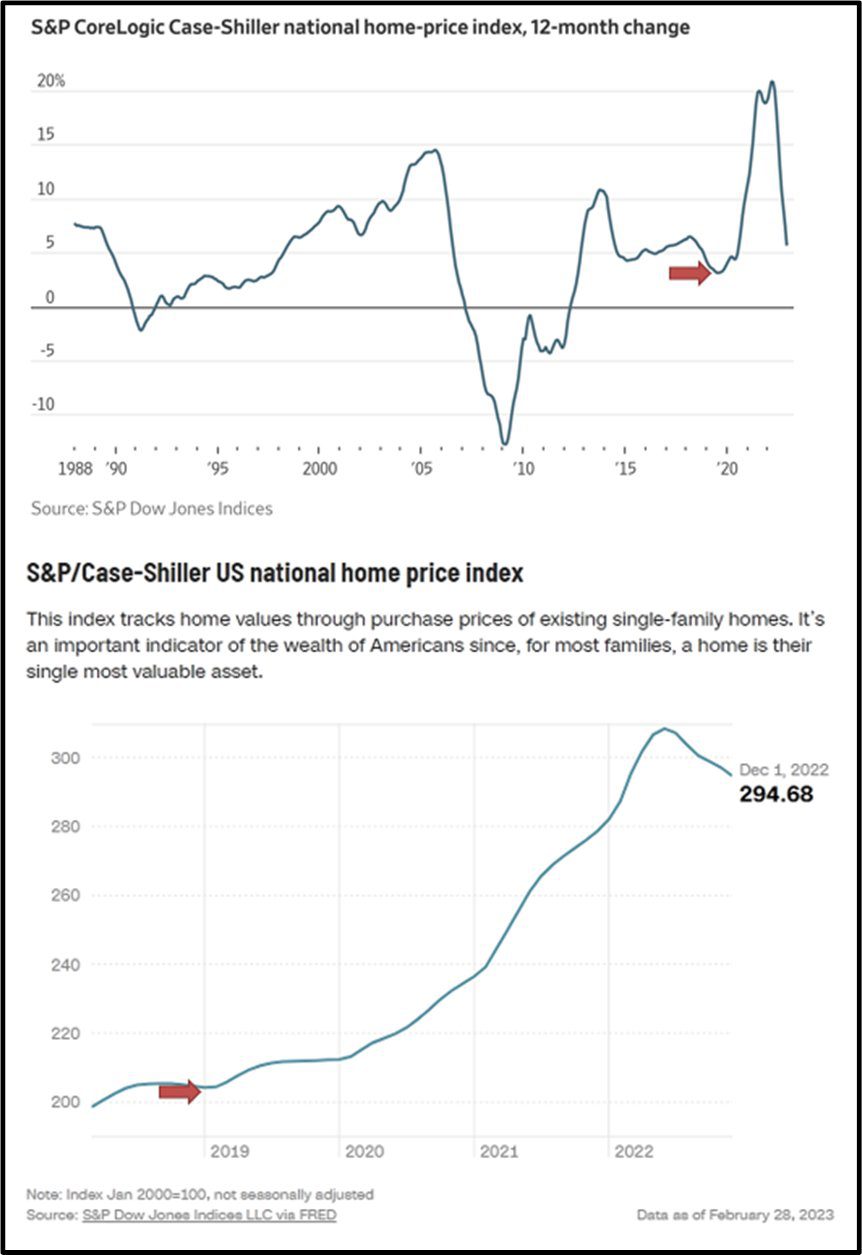
Home prices also remain elevated, though are modestly lower. However, mortgage applications are plummeting:
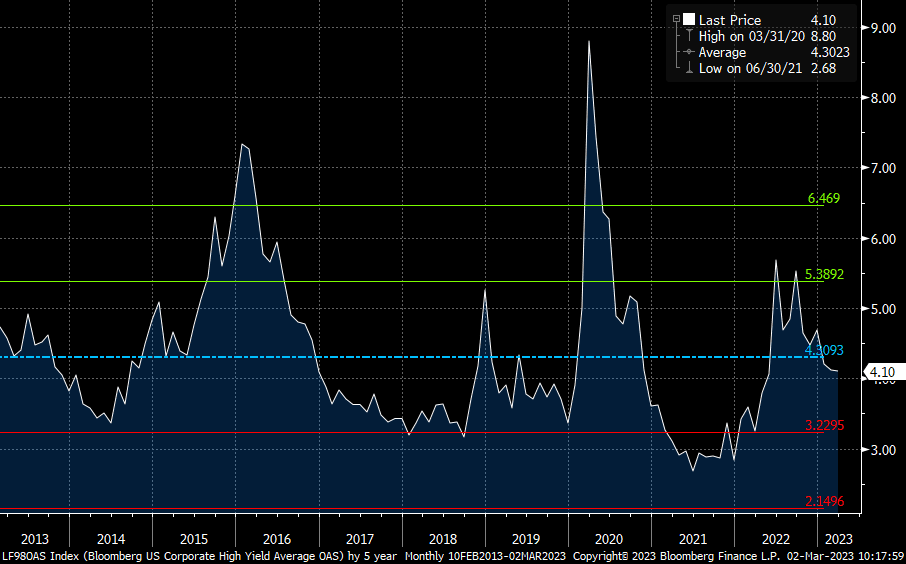
- Credit spreads – Negative but stable. Spreads do not reflect the likelihood of an economic slowdown. High-yield spreads are below their long-term average and have tightened this year. This is a contrarian indicator for us and would view higher spreads as an opportunity to become more sanguine about the prospects for stronger market returns:
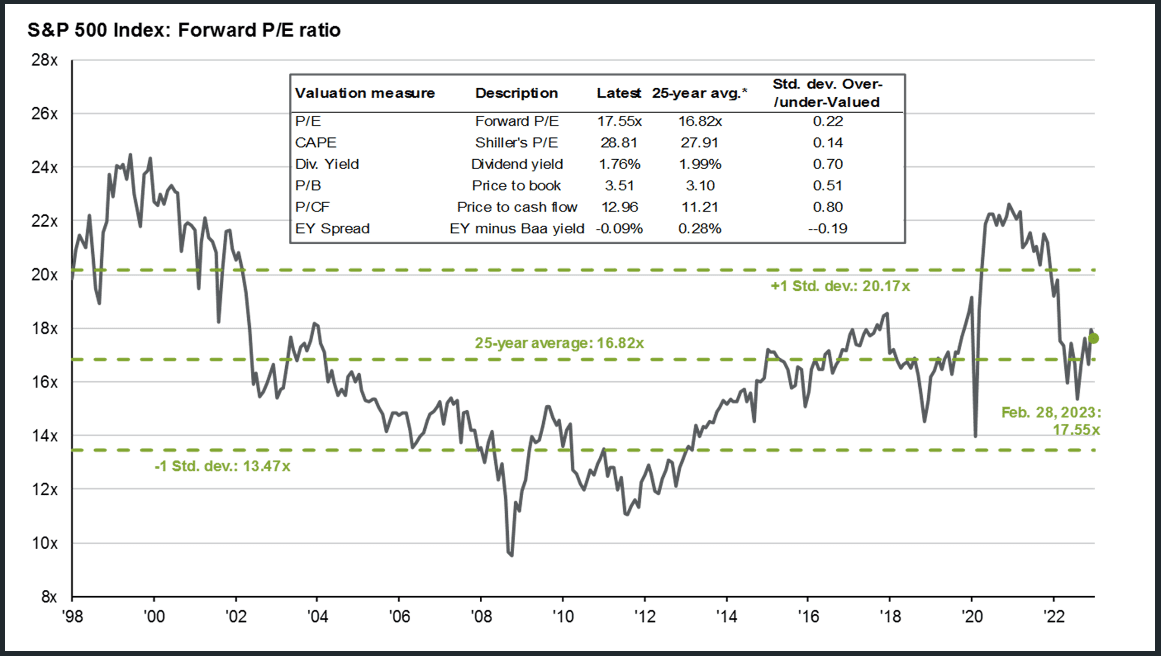
- Stock multiples – Negative but stable. Stocks, as a whole, are roughly in-line on an index basis versus recent history, i.e., the last 25 years. (More on this later.)
From a size and style perspective, large cap is the most expensive, especially on the growth side (i.e., typical megacap tech stocks).
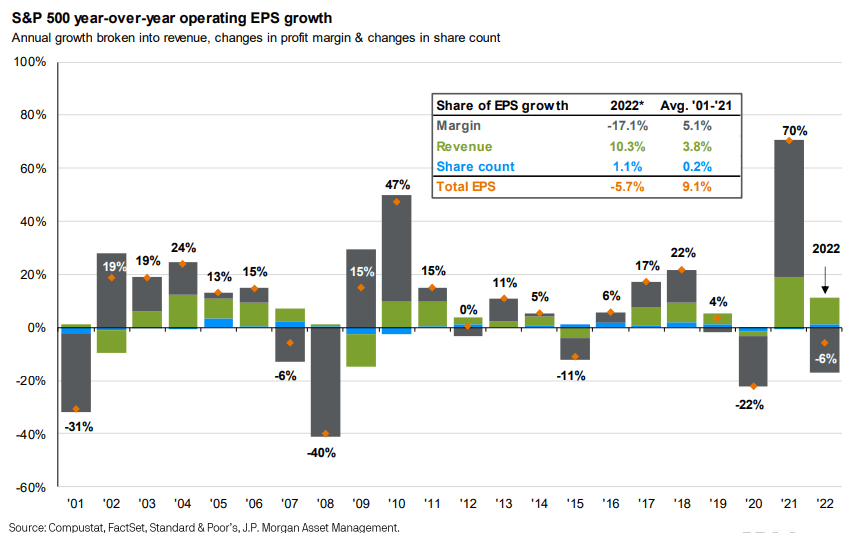
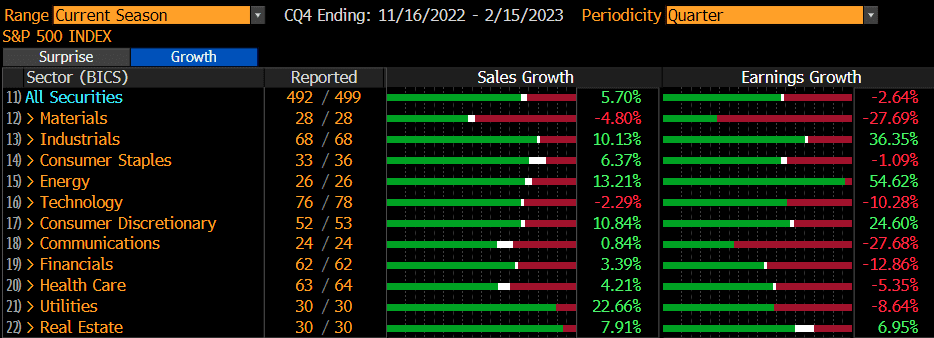
- Earnings growth – Negative but not worsening. Earnings were lackluster for Q4 and 2022. Revenues grew along with inflation, though margins declined. However, despite a decline from almost 14% to around 11%, margins remain elevated relative to their longer-term history.
Conclusion – Gravity…Again
We wrote about gravity last month, too, which is why we knew this sign was inaccurate:

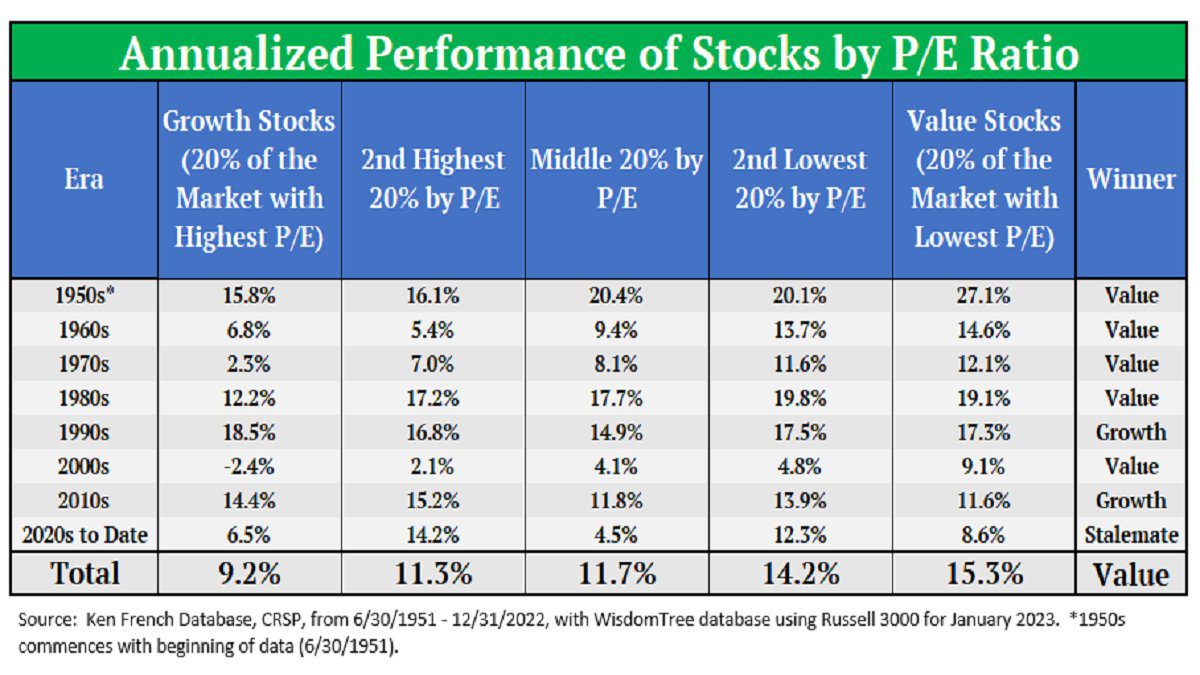
Gravity does not pull objects; it warps space and time. (I’ll include this in the letter to the Exploreum, too.) Stock valuations are like gravity in terms of warping the space around them. High valuations, ceteris paribus, are more difficult to overcome. There are periods of time when the most expensive stocks perform the best (the 1990s and 2010s), but on balance the probabilities are not stacked in your favor by owning them.
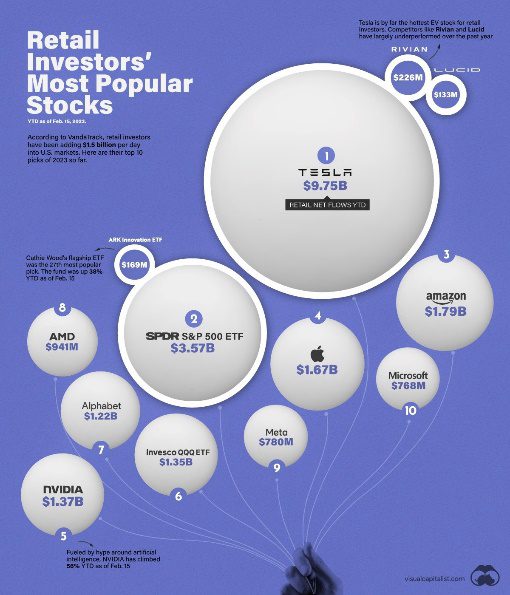
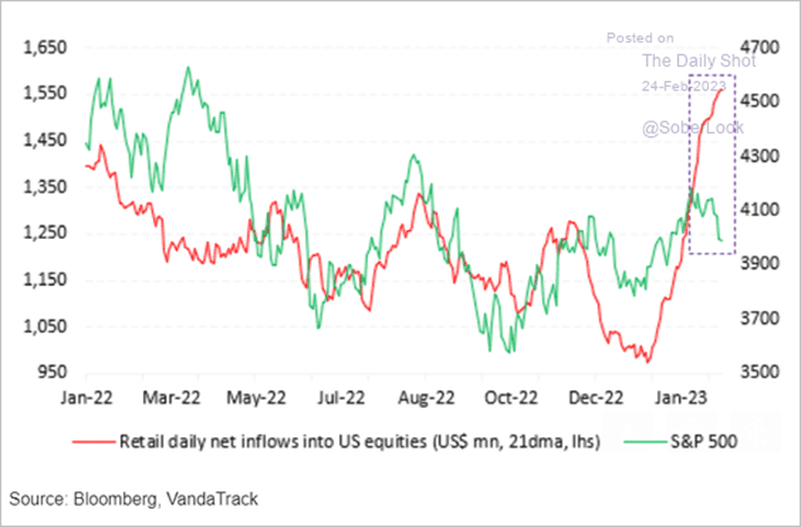
At present, the most highly valued stocks tend to be megacap technology companies – the last bull market winners, which retail investors continue to chase. On a year-to-date basis, gains for the S&P have been driven almost entirely by these retail names. Sources indicate that individual retail investors have spent almost $14 billion buying Tesla shares this year versus $17 billion for all of 2022:
Why is this important? Because highly valued stocks are long duration assets. The only way long duration assets have a chance of winning from these levels (the average trailing P/E ratio of the top five retail favorites is 63x) is if two things happen:
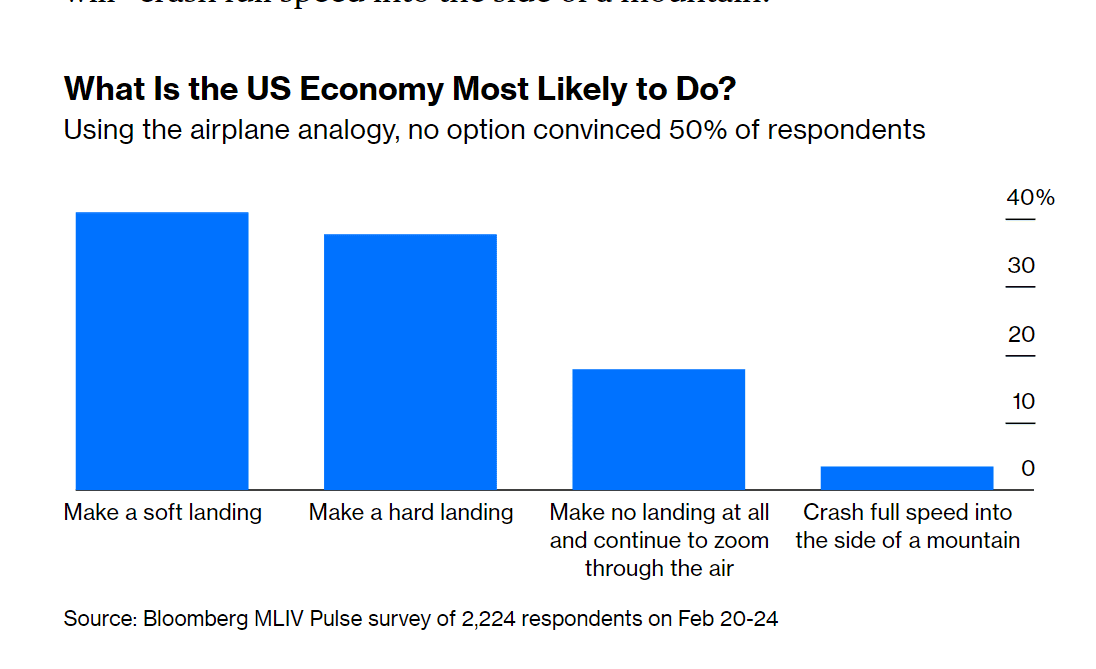
The first is that rates decline gradually, along with inflation. Based on our analysis, this would be most likely in a so-called “soft landing” scenario, which is the base case for around 40% of investors based on a recent survey:
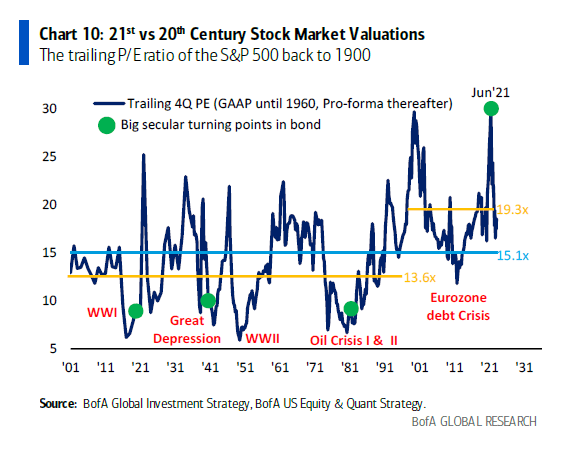
The second is that valuations revert back towards their Fed and stimulus-fueled valuations. As I continue to state to anyone who will listen, stocks are not cheap just because they are around 17% below their all-time highs. They are fairly valued versus recent history and expensive against the backdrop of the last 120 or so years:
Possibilities? Sure. Probabilities? In our analysis, extremely low. Let’s take at face value the 40% chance of a soft landing (seems high based on the shape of the yield curve) and multiply that by the amount of time the market has traded above its current level (let’s generously say around 15% of the time, though notice the spikiness). The number you get is 6%, making this a low probability bet.
We prefer to invest where the odds are in our favor. At present, this includes being more defensively positioned (cash, shorter dated bonds, dividend paying equities) and looking for opportunities in smaller cap names where our research process adds value.
Finally, The Exploreum had an exhibit on the legendary Monopoly franchise, including a new one for us, Rich Uncle, which was a 1950s stock trading spinoff. That the game puts “retail” stocks at the low end of the continuum is a little on the nose. With the current challenging macro backdrop, investors may be feeling like my son right now, i.e., in jail. But unlike many of our peers, who are content to just roll the dice and hope to collect $200 by passing “Go” enough times to eventually buy Boardwalk, the Monopoly equivalent of megacap tech, we continue to do the work required to maximize our clients’ odds of success. In Monopoly, that is owning the orange and red properties, statistically the most likely to be hit by your opponents and hence the best value for the money. Our process is designed to unearth the stock market equivalent of these properties, so we leave as little to chance as possible.


READY TO TALK?