


Market Commentary – July 2023 Update – The Ocean Called
July Update: The Ocean Called
A little different format this month as we start with a note from Will, followed by the usual monthly update.

From the (Deck) Chair
“As we slowly drift by the island of Capri and the sun rises in the east, I am reminded that smooth and calming seas are a temporary phenomenon. I’ve been traveling with my family recently, and I’m not seeing very much evidence of an impending recession. In fact, quite the opposite. I see people spending money, living large, traveling. My social media feeds are filled with people all over the world; it is a truly global phenomenon. Maybe it’s just my age but I can tell you the world is on the road, and they don’t seem to really care about what the Federal Reserve thinks…. Calm Seas.
But like everything else in life, calm can be the precursor to the storm. In this case, we are seeing wild volatility trading in very short-dated options, which is controlling volatility measures in the broad stock market. Having been in Athens recently, I am reminded of the battle of Thermopylae, and I believe zero dated option traders are simply Spartans about to be stormed through by the hordes of Persians. So far, it’s been an episodic battle of the 300, if you will, with short options controlling volatility, and not letting the dragon out of the cage.
Simply put, these traders have virtually zero chance of continuing to hold their ground. Momentum will shift and now gigantic, heavily leveraged quantitative algorithmic trading platforms will exacerbate this event. At first, it will look like a pop-up thunderstorm only to be followed by a category five hurricane volatility storm. The impending volatility storm will be started with something that, at first blush, seems benign. Not a threat at all….Something innocuous, but in that moment, something else will begin to cascade and then – and only then – will you truly know where this begins.
Investors are trying to convince themselves again that it’s different this time. No, it’s just as stupid as the last time. And the time before that …and the time before that….. and the time before that ….because innovation is the product of trial and error, not just trial. We hear things along the street of dreams like AI is going to lead the charge in the next technology revolution. Is it? I don’t know but I can tell you that every time something new has come out that is supposed to solve everything it rarely does. In fact, typically it makes things worse before any improvement emerges.
I find it hilarious that all of these financial companies are bringing on AI to help them augment their trading platforms. I guess everybody forgot about 1987, when in 15 minutes 25% of the value of the stock market was wiped out due to machine program trading.
It’s almost moronic to see these types of events because for those of us who have been doing this for a long time, we simply will not relent our core belief system: that the markets are heavily overvalued, completely narrow, and utterly dangerous. Unfortunately, being proven right is being injured with the rest of us. We don’t relish this position. Investors chasing the NASDAQ right now are simply buying someone else’s trouble and at this juncture I have never seen a market more detached from reality.
Volatility storm is coming. It won’t be long from now. Could be a doozy.”
July Update – Key Takeaways
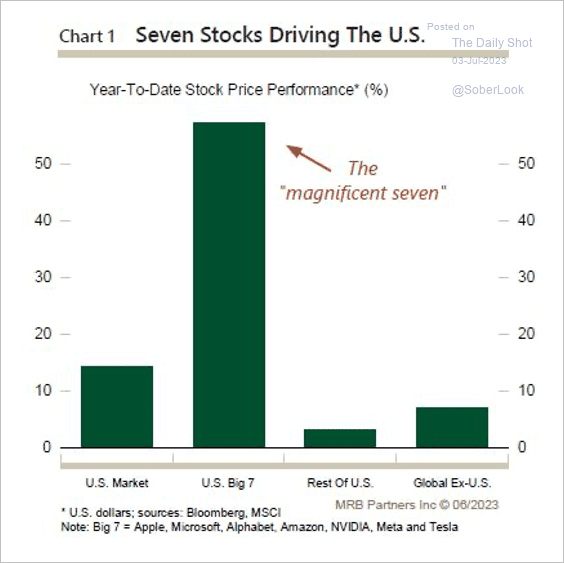
- Seven (7) stocks, fueled by AI mania, account for all the market’s return in 2023.
- Employment and economic growth remain resilient, but so does inflation.
- With everyone piled onto the same side of the ship, we look for opportunities elsewhere.
With many of our readers on holiday, we are going to kick off summer at the ocean.
June Recap – It’s a once-in-a-lifetime opportunity
“But look at it, Johnny. Look at it! It’s a once-in-a-lifetime opportunity, man! Just let me go out there.” Bodhi, Point Break
That’s what we keep hearing about AI stocks, which are rivaled only by pickleball (discussed on our recent podcast) from a mania perspective. If you have 45 minutes and want to really understand what is built into the price for AI’s poster child, NVDA, watch professor Aswath Damodaran’s outstanding presentation. His conclusion is:
- The intrinsic value, even based on “upbeat narrative,” is well below its current price, but…
- He is still going to hold some as an option.
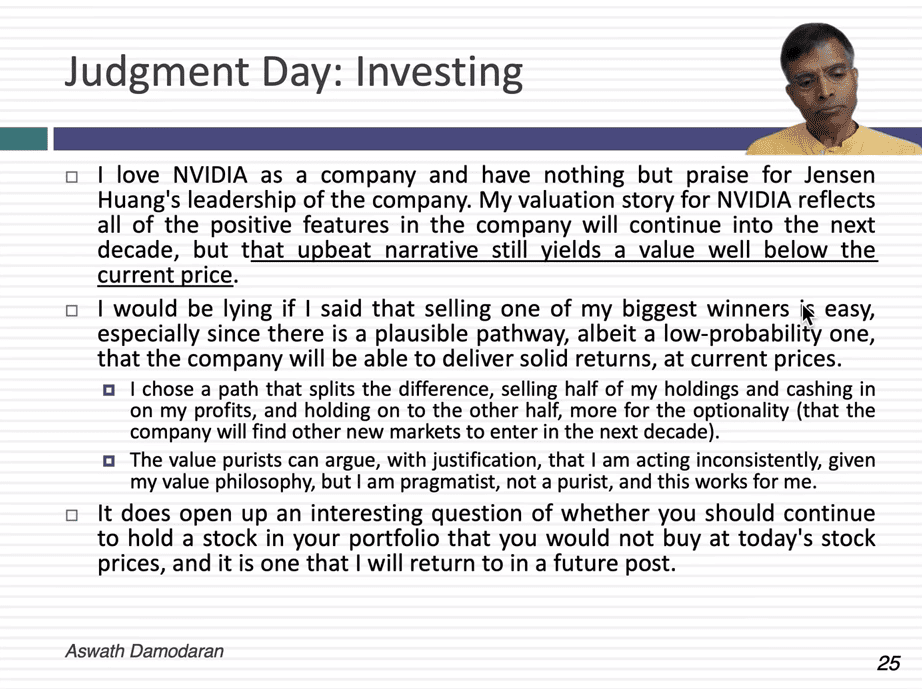
In other words, it’s a once-in-a-lifetime opportunity and he is going to ride the wave (with half his position). He states that he looks at the optionality, then goes on to examine the difference between trading and investing, a topic we have discussed in the past as well.
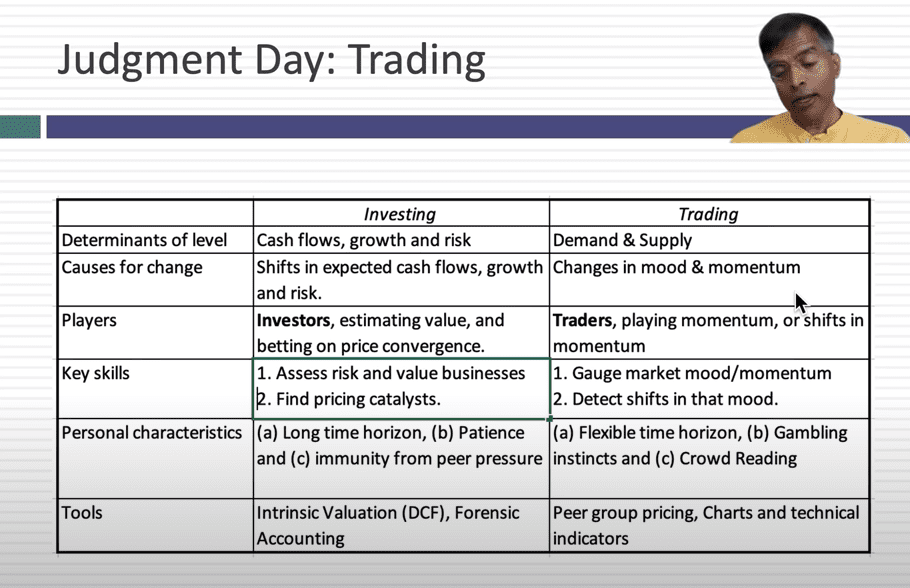
If one of the most thoughtful practitioners of value, the so-called ‘Dean of Valuation’, is surfing, shouldn’t we jump in the water? For those who have seen Point Break, the answer is no. Bodhi does not return, and Damodaran is explicitly stating this is trading, not investing. The waves are just too high, and we see the same thing here, whether it is regarding NVDA’s valuation, or the massive outperformance of technology stocks year-to-date.
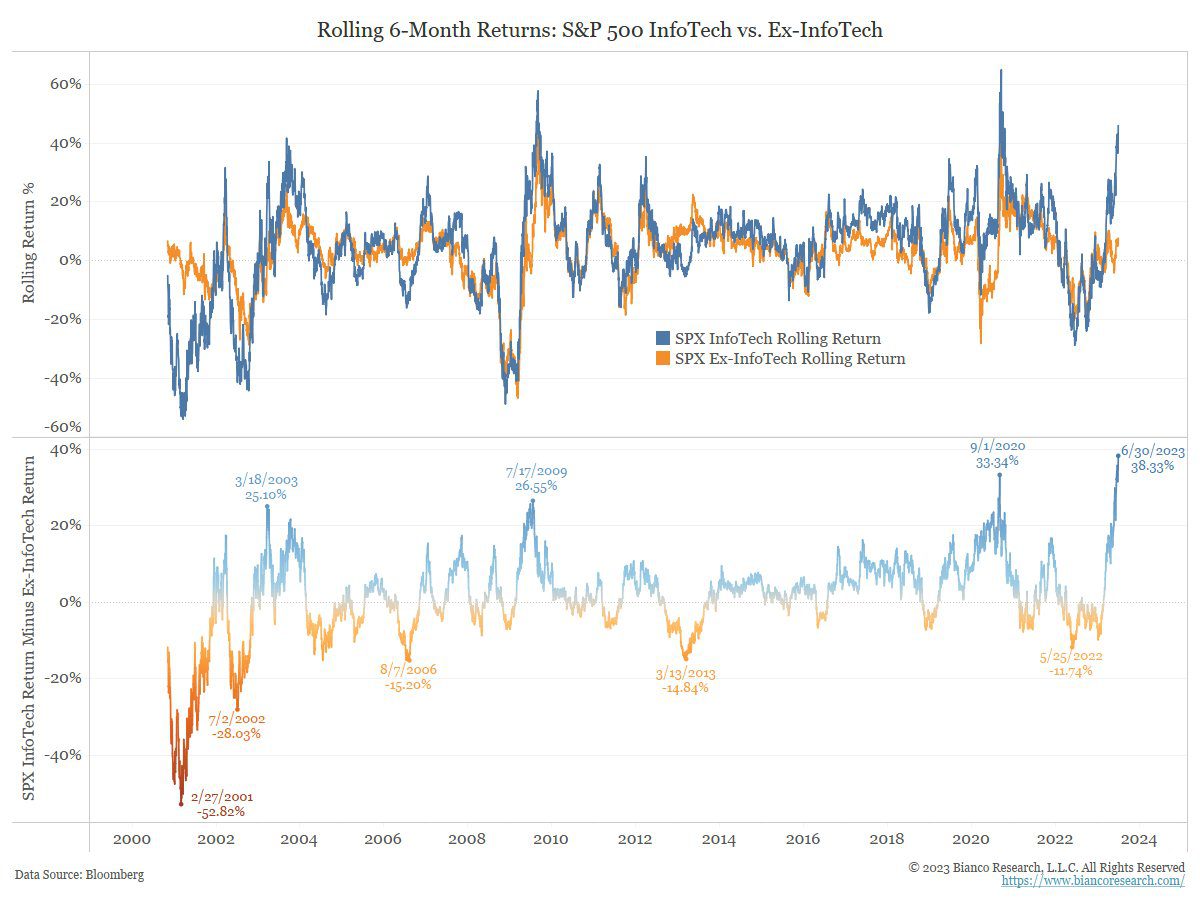
The NASDAQ is off to its best start since 1999, and yet, according to Callum Thomas, “if we look at the percentage of Nasdaq stocks with negative earnings, it has just reached a new all-time high. If you argue that it is a fundamental driven rally, it ain’t showing up in the numbers (at least not yet?).”
This narrow band of outperformance means there has seldom been a more challenging time to be an active manager.
- The top 10 stocks in the S&P 500 typically account for 32% of the S&P’s return each year; it is 82% this year.
- The positive contribution from the top 10 stocks is the largest since 1991.
- The outperformance of the market-cap-weighted S&P 500 year-to-date is nearly 10% versus the equal weight S&P; this level of outperformance happens about 2% of the time.
| Index | 1-Month | 3-Month | YTD | 1-Year |
| S&P 500 INDEX | 6.61 | 8.74 | 16.88 | 19.56 |
| Invesco S&P 500 Equal Weight E | 7.65 | 3.92 | 6.93 | 13.50 |
| NASDAQ Composite Index | 6.66 | 13.05 | 32.32 | 26.17 |
| Russell 2000 Index | 8.13 | 5.19 | 8.06 | 12.27 |
| MSCI EAFE Index | 4.58 | 3.19 | 12.16 | 19.53 |
| MSCI Emerging Markets Index | 3.83 | 0.97 | 5.02 | 2.12 |
| Bloomberg US Treasury Total Re | -0.75 | -1.38 | 1.59 | -2.13 |
| Bloomberg US Agg Total Return | -0.36 | -0.84 | 2.09 | -0.94 |
| Invesco DB Commodity Index | 2.95 | -4.38 | -7.91 | -14.28 |
Source: Bloomberg (as of most recent month end)
July Outlook – I’m not going to dumb it down for some bonehead mass audience.
“It’s smart. It’s a smart line, and a smart crowd will appreciate it. And, I’m not gonna dumb it down for some bonehead mass audience!” George Costanza, Seinfeld
Admittedly, a stretch here on the quote, but our title, The Ocean Called, was the genesis of this classic Costanza tirade.
As we will see momentarily, our process continues to indicate caution. However, the strong first half of the year we have seen typically begets more strength.
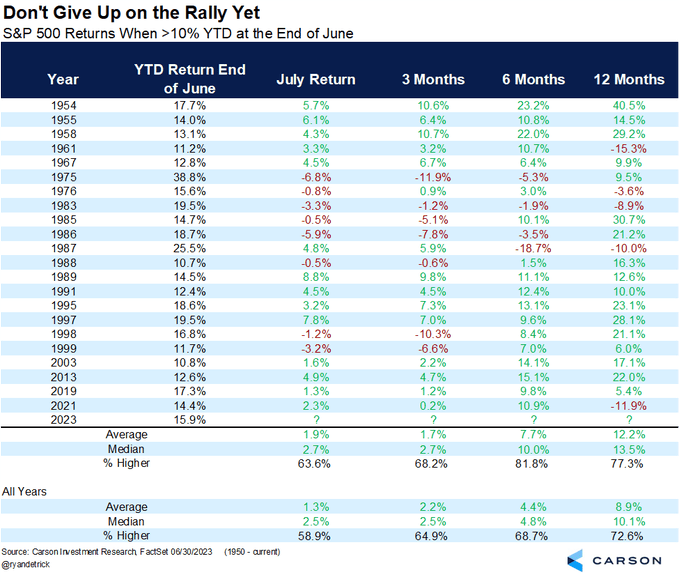
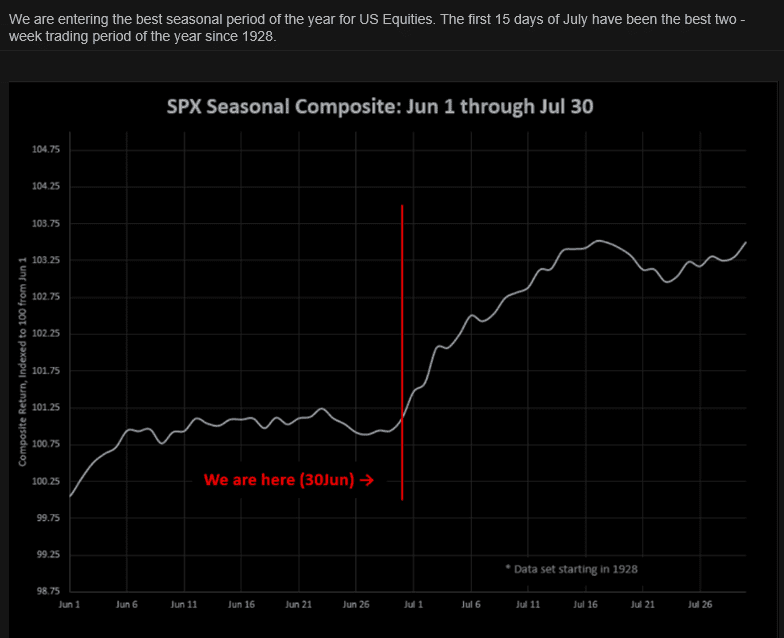
Moreover, July is historically a strong month for equities.
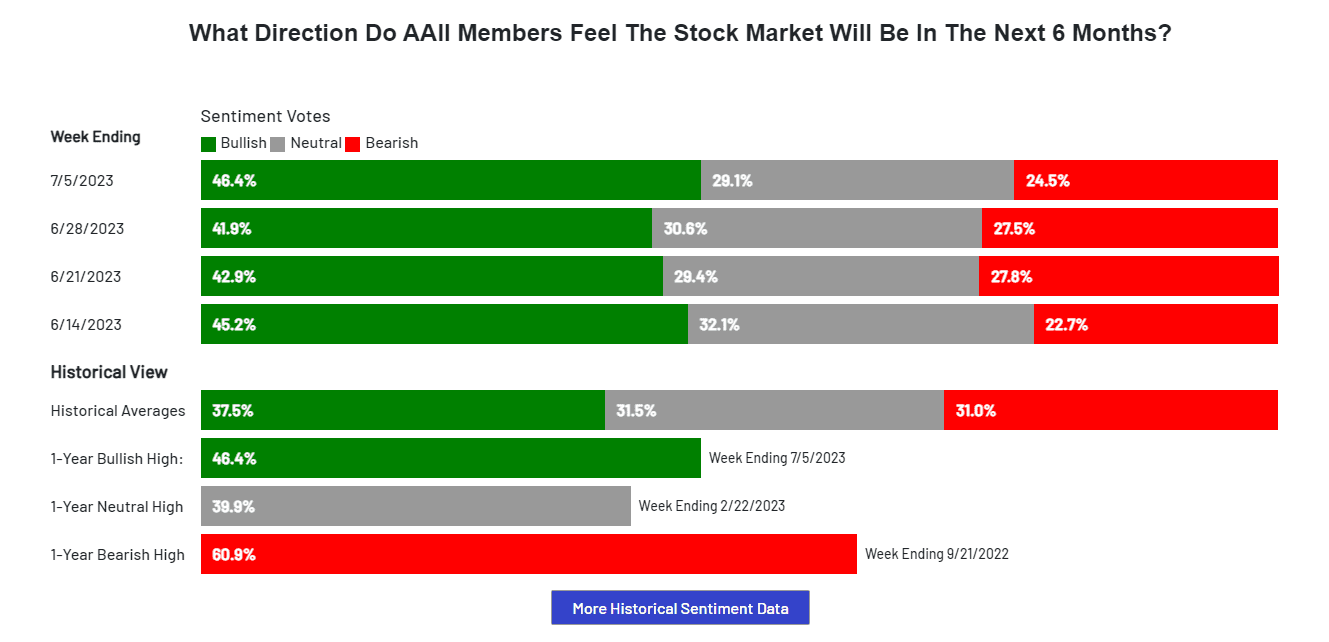
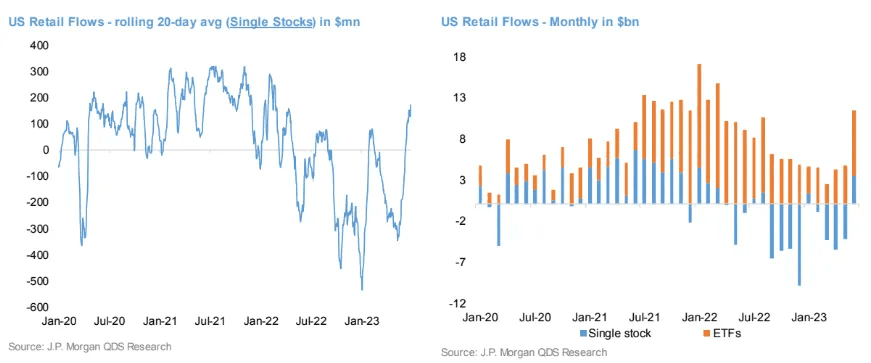
What is driving this market higher? In our opinion, it is the bonehead mass audience, i.e., retail investors, who are feeling as bullish as at any time since November 2021 and buying both ETFs and individual stocks at levels last seen in early 2022. For those who remember back that far, November 2021 was the prior crest of the NASDAQ.
As we reiterate constantly, feeling is not part of our process, though we are cognizant of the effect of emotion on the average investor. The seven key factors we track showed slight change month over month and are still very much skewed toward caution, with GDP growth becoming less negative but valuations becoming more problematic, especially in certain areas.
| More Negative | Neutral | More Positive | |||
| Inflation | ≈ | ||||
| GDP Growth | → | ||||
| Fed Policy | ≈ | ||||
| Interest Rates | ≈ | ||||
| Credit Spreads | ≈ | ||||
| Stock Multiples | ← | ||||
| Earnings Growth | ≈ | ||||
| Deteriorating | ← | ||||
| Stable | ≈ | ||||
| Improving | → | ||||
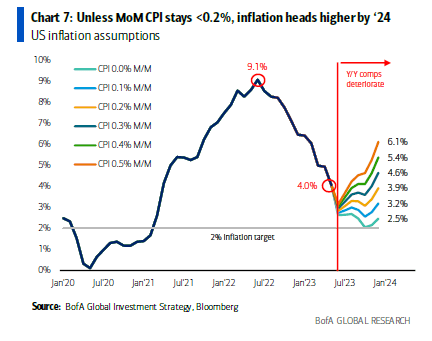
- Inflation – Negative but stable. May core CPI came in at 0.44%, which would annualize to around 5%, well above the Fed’s 2% target and worse than expected.
Mike Ashton, a.k.a., the Inflation Guy, stated “There is nothing in here that supports the notion that the Fed will soon be able to stop worrying about inflation. M/M core inflation continues to run at a 5%-ish level. Y/Y core will likely ease a little further on base effects through September and then level off.”
So much of inflation is just base effects, i.e., what the level was last year, and that math puts the path higher in the absence of severe deceleration. Having said that, it is likely the June inflation number will see headline CPI in the 3% range, although the path forward from there appears upward.
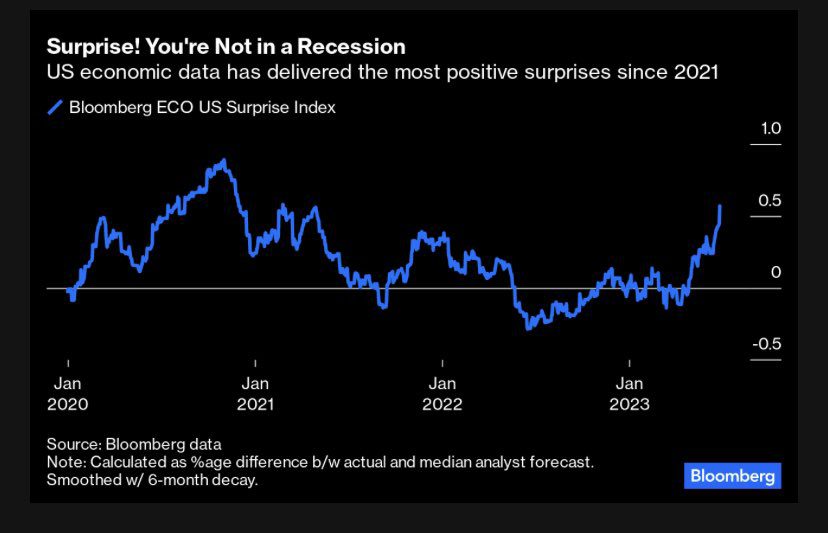
- GDP Growth – Negative but improving. Is a recession imminent? Not necessarily. Some, like RenMac’s Neil Dutta, see an economy with no recession in sight. Strong payrolls numbers like those posted on July 6th are certainly not recessionary (albeit employment is typically a lagging indicator). Other economic data has surprised to the upside as well.
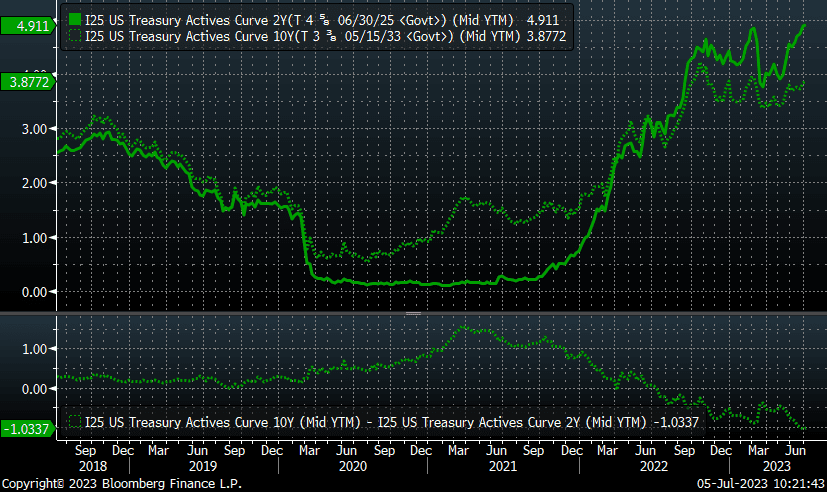
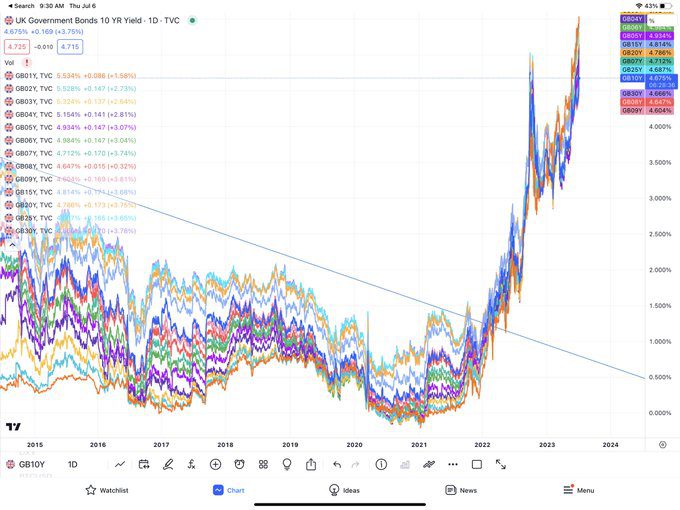
However, the yield curve became more inverted during June due to the continued increase in the yield on the two-year Treasury (solid green line). At 1.03%, the yield curve is now more inverted than it was before the Silicon Valley Bank scare.
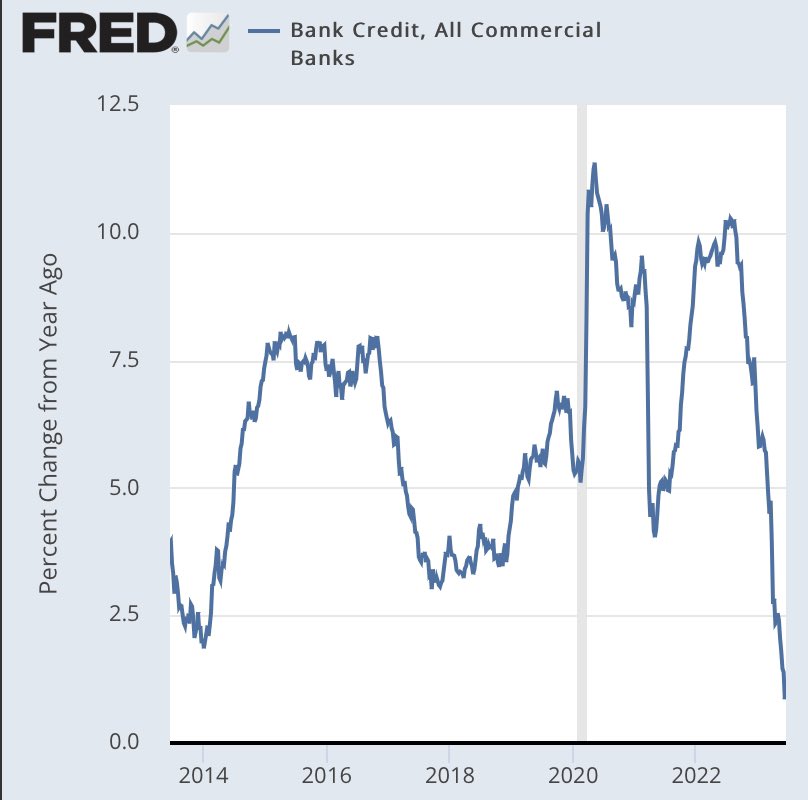
Additionally, credit is becoming tougher to get.
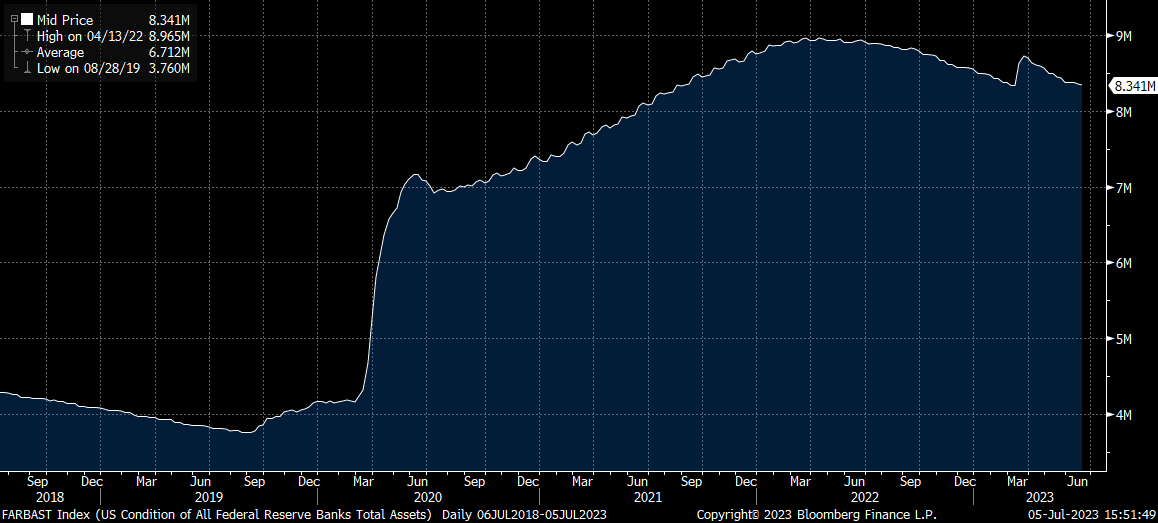
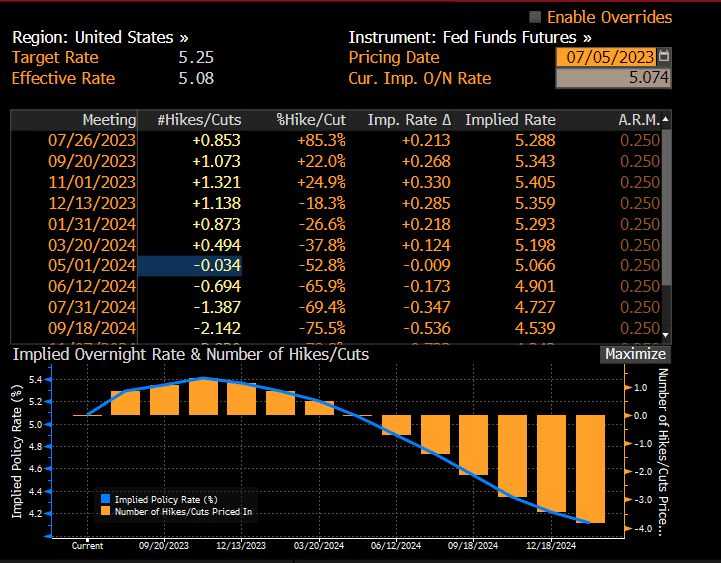
- Fed Policy – Negative but stable. Quantitative tightening has resumed post the spring banking tumult, i.e., the Fed is reducing the size of its balance sheet, albeit from elevated levels. After skipping a rate increase in June, odds are at 85% for a hike in July.
- Interest rates – Negative but stable. The 10-year Treasury increased slightly in June, and effective rates on both credit cards and mortgages remain elevated in absolute terms and versus treasuries. The cumulative debt burden on consumers is a concern, and student debt repayments are scheduled to resume in August.
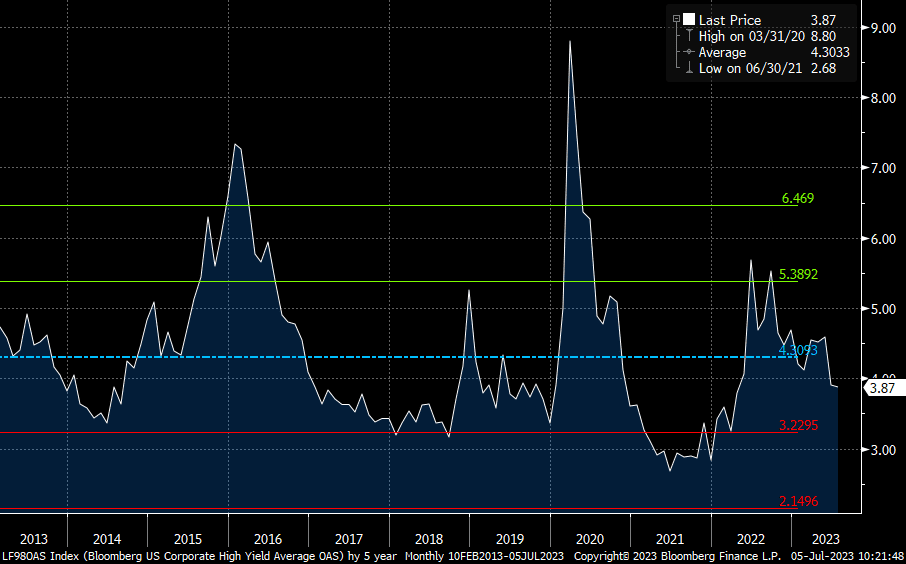
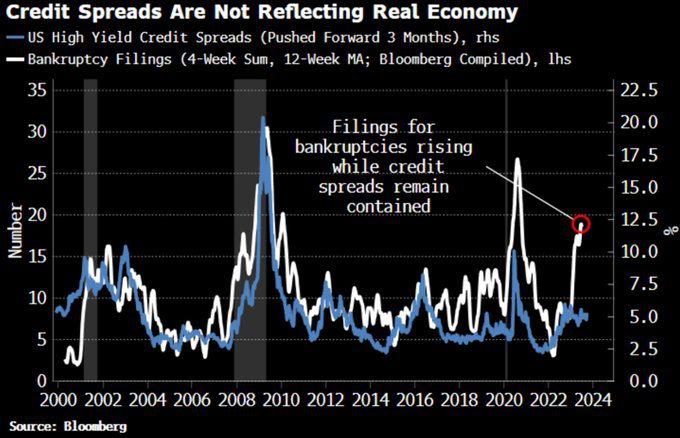
- Credit spreads – Negative but stable. A reminder we use this as a contrarian indicator. Spreads are indicating no stress despite bankruptcies soaring. We think a structural issue with constricted high-yield bond supply may be causing an aberration.
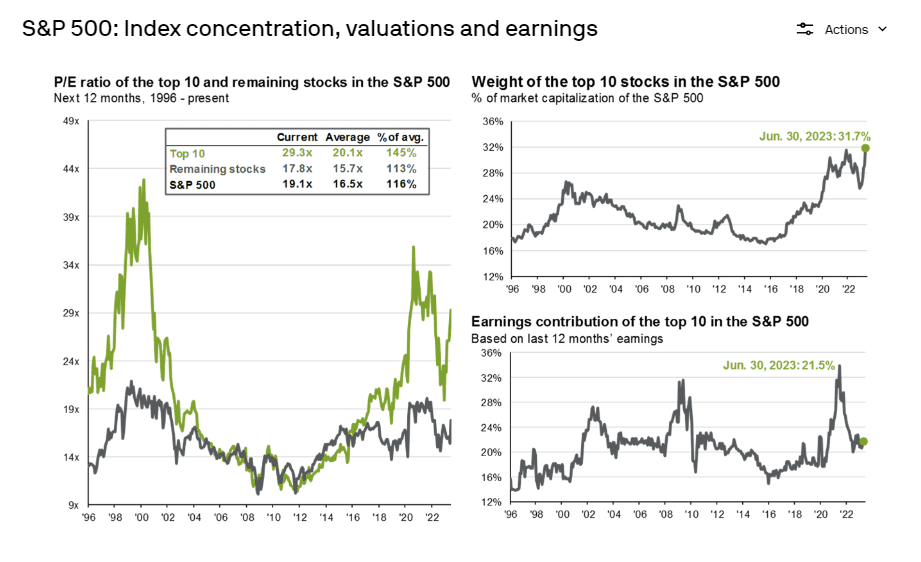
- Stock multiples – Negative and deteriorating. Stocks are not cheap at the index level. Large cap stocks are more overvalued than mid and small stocks, and growth stocks are more overvalued than value stocks. The largest, growthiest stocks, which comprise the top ten in the S&P 500, trade at a forward P/E of 29x; the average P/E of the top 10 is 20x. The index has never been more top heavy despite the top 10 contribution to earnings declining sharply.
From a sector perspective, only two of the 11 sectors trade at a meaningful discount versus history.
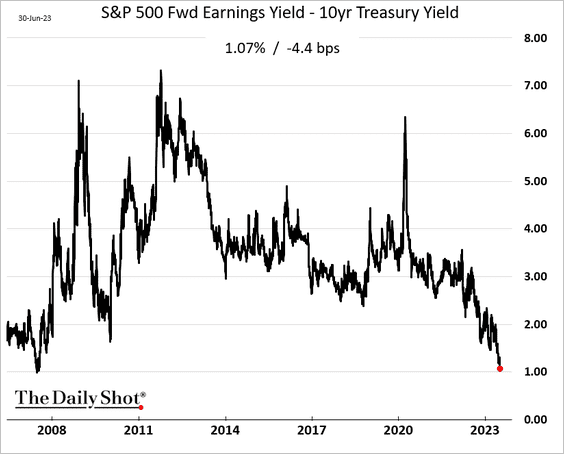
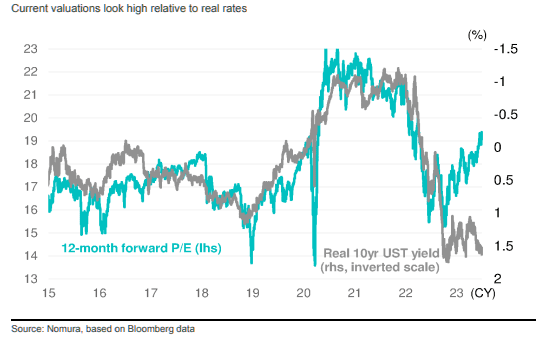
Most damning is that relative to fixed income, the premium to own equities has not been lower since the lead-up to the financial crisis, and the tight link between P/Es and real Treasury yields has diverged. Are bonds wrong, or stocks?
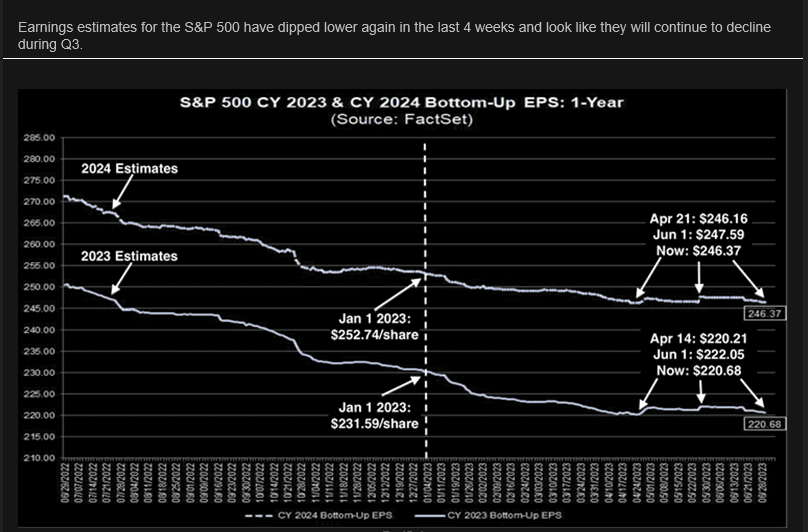
- Earnings growth – Negative but stable. Earnings expectations for 2023 have fallen slightly (about 5%) since January. We have seen a similar shift for 2024 expectations, though over 10% earnings growth is still projected. Against a backdrop of weakening consumer spending, higher interest rates, and the resumption of student loan payments, we believe 10% growth may be ambitious.
Conclusion – I assure you, she can.
Bruce Ismay: “But this ship can’t sink!” Thomas Andrews: “She’s made of iron, sir! I assure you, she can. And she will. It is a mathematical certainty.” Titanic
As Will stated cogently in his intro, the markets are heavily overvalued, completely narrow, and utterly dangerous. Buying the “can’t sink” winners at the top of the internet bubble seemed like a sound strategy, too, but resulted in this:
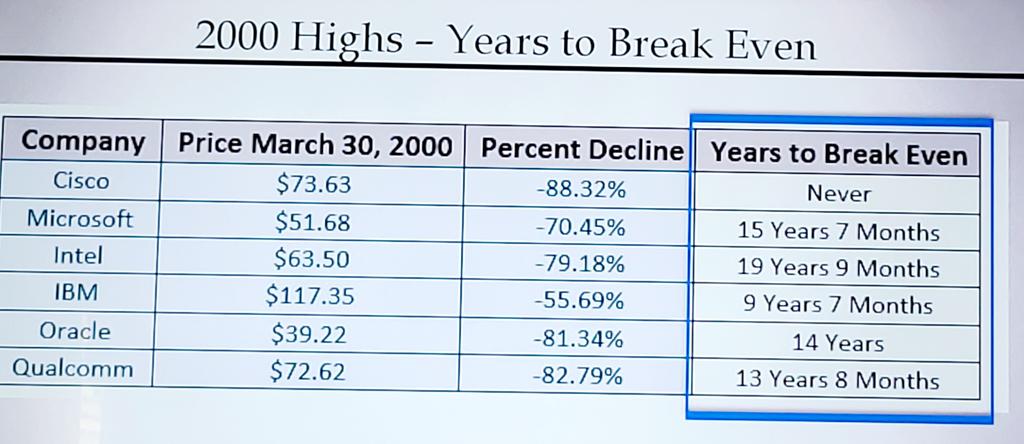
What companies are missing from this list? Google and Facebook, to name a couple. The reason we mention this is that the “winners” of the AI race may not be publicly traded or, for that matter, even exist today. Facebook was not started until 2003, when it was known as FaceMash.
As fundamental investors, are we going to be able to predict the winners of this race, which has no end date, no certain economic payoff, and an unlimited number of potential entrants? The answer is no. This is not to say we do not like growth; we do. However, the concept of growth at any price made no sense in 2000, and it makes no sense today. As Damodaran stated on Twitter, “AI is likely to bring extraordinary changes to our lives & markets, but if history has lessons, it is that it will create a few big winners and lots of losers, and cause investors more disappointment than hope, especially if they buy into buzzwords.”
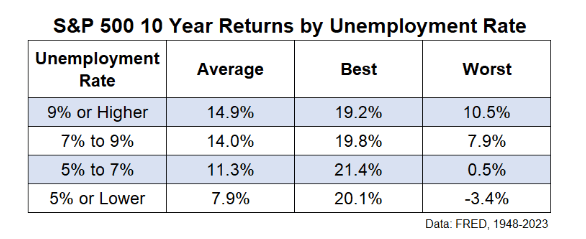
What we can do is manage our process, emphasizing the sources of return we are better able to control, and manage the risk in client portfolios. Our approach is designed to be countercyclical. We see the efficacy of going against the trend when looking at something like the unemployment rate. As a lagging indicator, it is a metric that is among the last to break during an economic downturn, which is why longer-term returns are less good when unemployment is low. The July 7th print was 3.6% as a point of reference.
As Will states, something seemingly innocuous could cause the market to unravel. What almost caused a catastrophe last fall, the sharp rise in U.K. yields, has returned with a vengeance. Can we put this genie in the bottle for a second time?
To bring this full circle, we believe there is a degree of deck chair re-arranging as it relates to the index. Companies are moved in or out (usually out) of a sector to provide the appearance of diversification, when in fact the technology sector, as it used to be defined, would comprise nearly 36% of the S&P 500 today; the prior record was 34.5% in March 2000.
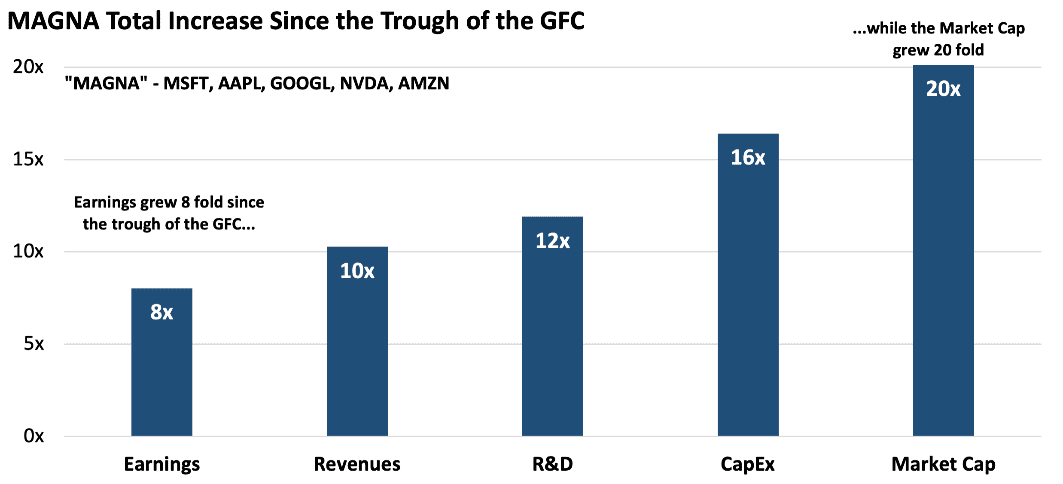
Have tech companies grown more than the market since 2008? Absolutely – though this has more than been fully reflected in their values, which have grown more than twice as fast.
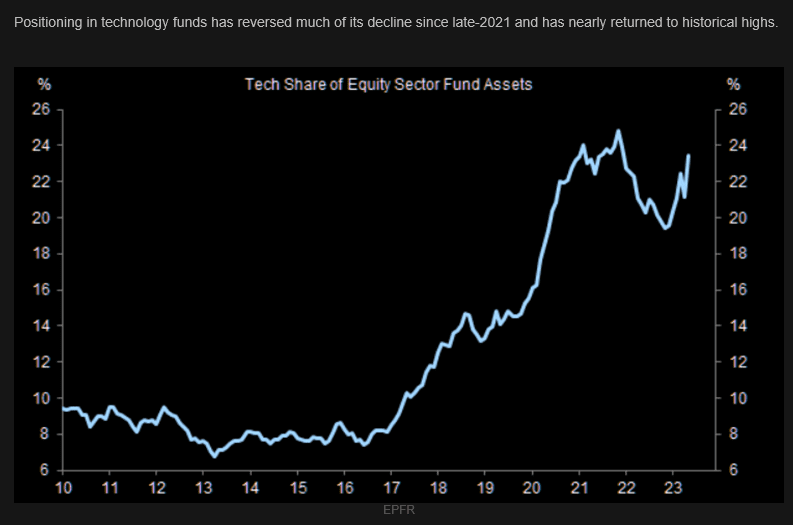
When everyone else is piled on one side of the ship, it is normally not a good idea to join them, and from both an index and fund perspective, the AI/tech side of the ship is crowded and expensive. A recent WSJ article highlighted the stunning performance of technology mutual funds.
Our approach is to look at the long-term drivers of returns and focus on getting our investors safely to shore with an appropriate level of risk. One of our interns, Sathya Panchu, did a fantastic research project for us. He looked at the sources of return for the S&P 500 going back to 1900.
Three interesting things to note:
- Returns for equities in the post-WW II period (1950 through May 2023) were almost 10% on an annualized basis, far higher than for the entire period we studied (around 5% annualized from 1900 to present).
- Dividend yield was the most impactful factor in looking at the totality of the study, followed by growth, then multiple expansion.
- Multiple expansion is the most volatile factor.
Sathya’s work shows that since 1950, the factors driving the return for the S&P 500 are as follows:
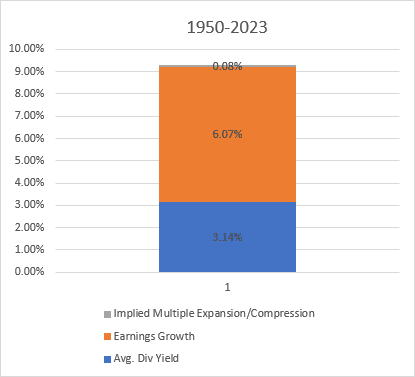
So, how can we use this to position portfolios today?
- Emphasize dividends. The one component that is a) always positive, and b) known when you buy.
- Look for sustainable growth. Instead of trying to find the next exponential growth story name, look for mature companies with a history of solid execution and reasonable growth prospects.
- Avoid overpaying. The market is expensive, certain sectors more so than others. How much the market is willing to pay for a dollar’s worth of earnings waxes and wanes over time.
Our job as investment managers has probably never been more challenging, but these are also the times when we have the potential to add the most value through active portfolio and risk management.
READY TO TALK?