

May Update: Indiana Jones
Will Brown, our CEO, wrote a great “from the desk” piece on April 29, delving into not just the market but more so the geopolitical factors (Ukraine, China lockdowns) markets are facing . We had a client or two slightly ask questions about the closing quote. As a fan of Indiana Jones, not to mention someone who spends hours every day talking with Will, I knew what he meant, but suffice it to say ”I’m making this up as I go” is a reference to the market’s response to the litany of data points it is digesting. We will delve more into how we have been positioning portfolios toward the end but let us start by putting a finer point on the market factors Will referenced, using our other favorite lines from the Indiana Jones trilogy.
I said no camels. That’s five camels…Can’t you count?
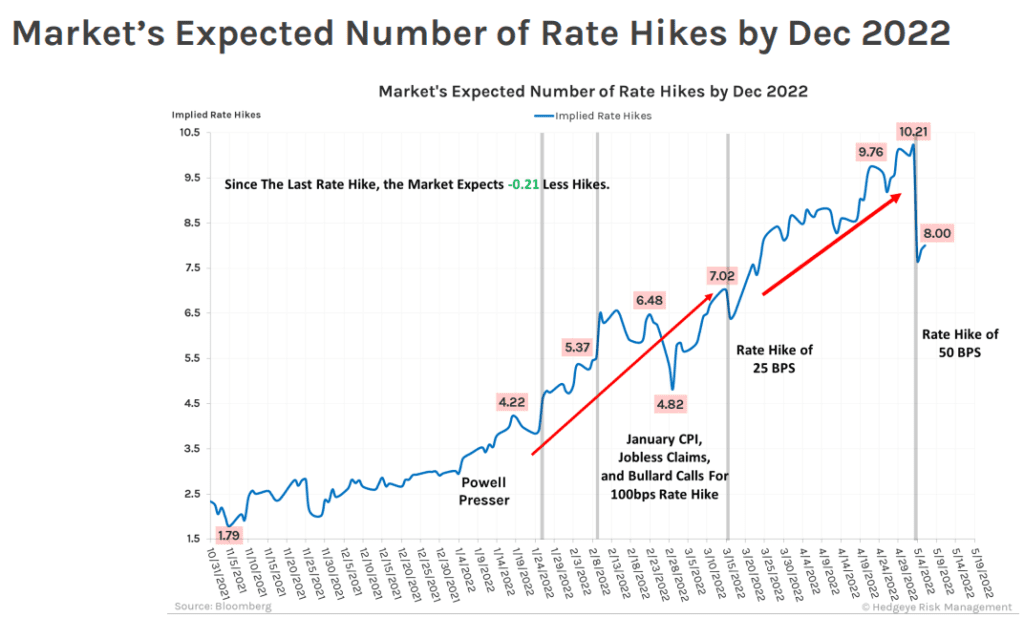
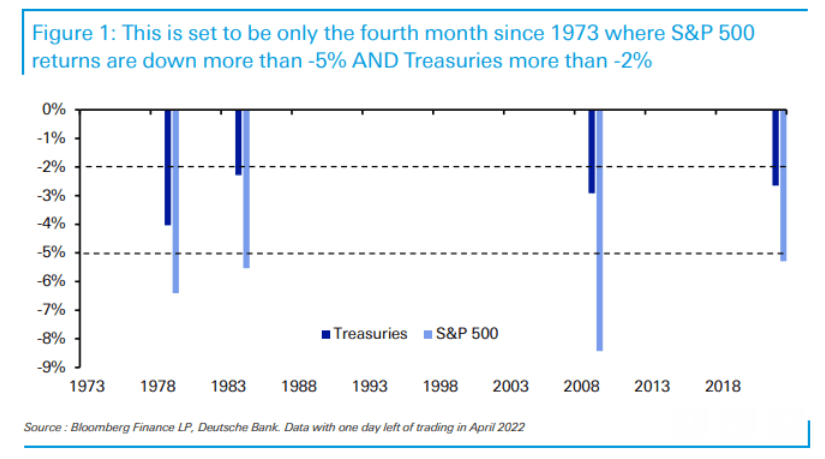
Before we get to the elephant, well, camel, in the room, which is a historically bad April for equities, let us look at one of the root causes: The Federal Reserve. More specifically, investors tend to view rate increases like camels: fewer is better. Going into the meeting, we were expecting over ten…by December. The Fed made good on two (2) at the May meeting, bringing the count to three (3) hikes so far, with eight (8) more anticipated.
The narrative that has governed equities post Covid has been; “there is no alternative,” i.e., one must own equities because the opportunity cost is zero. That is now changing, with real yields positive (albeit modestly) for the first time since March 2020.
Fixed income investors are no dummies, so the market clearly believes that the Fed is serious about fighting inflation (as discussed in the past, we believe there is tremendous political pressure to do so.)
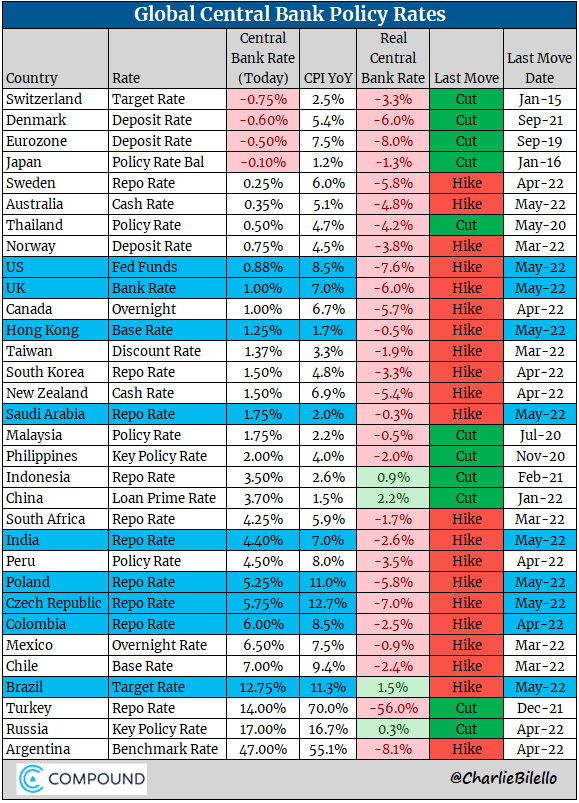
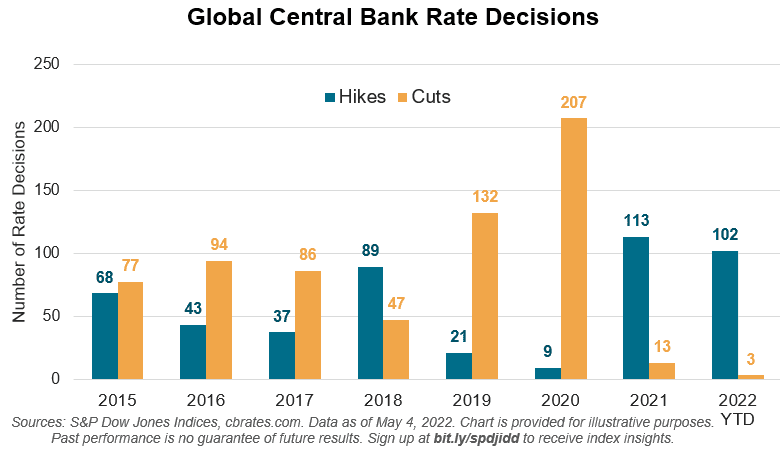
Also, before moving ahead, important to keep in mind that the Fed is not the only central bank that is not in an accommodating mood.
Also, as Will mentioned in his piece, the Fed is sensitive to the potential collateral damage tighter monetary policy may cause, though we would argue that the so-called Fed put, the price at which the Fed would change course on monetary policy, remains below the current level of the S&P 500 index.
A boat? We’re not sinking, we’re crashing
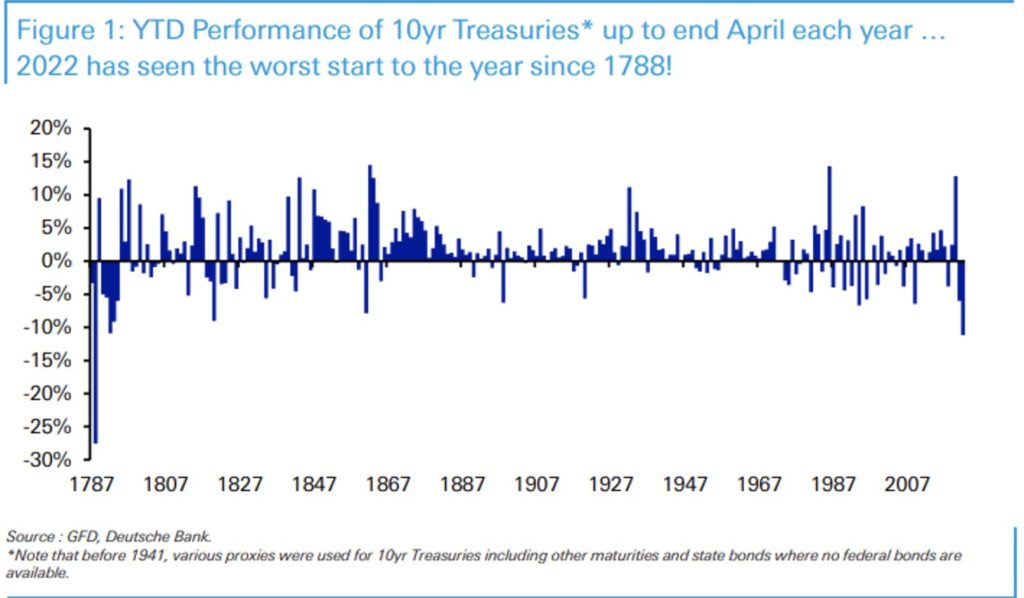
For bonds, one could call this a crash, the worst start to a year for the benchmark U.S. 10-year Treasury since 1788, one year before the “$10 Founding Father” became Secretary of the Treasury.
Much like a life raft is not an ideal safety device in a plane crash, so, too were bonds not a helpful diversifier in April. The Fed’s aggression saw to that.
And now to the equity markets, which stole the show for all the wrong reasons in April.
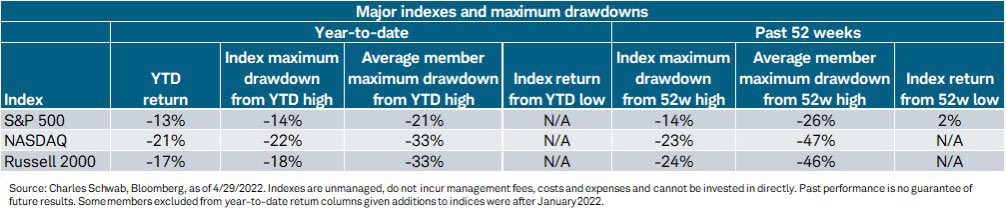
Like the overconfident Indiana Jones, index stalwarts, long assuming they were well out of range of the Fed’s artillery, started to catch down toward their brethren. However, as we have discussed ad nauseum, the indices continue to hide the massive damage done at the individual stock level, a by-product of active options trading and passive fund flows. The average large cap stock is down over 20% year-to-date; the average for small cap and tech stocks is 33%, though that figure shows a loss of close to 50% if we look back to the 52-week highs.
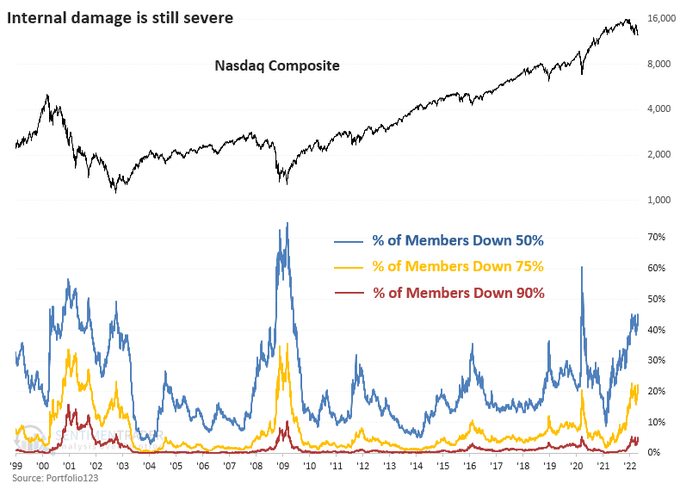
To provide a little historical context (at least for the NASDAQ), in April we reached levels of damage at the individual security level that exceed the last bout of Fed rate increases (2018) and are more akin to the kneejerk Covid meltdown or the financial crisis, per the below graph. May has seen further damage.
We are simply passing through history. This… this is history.
Although painful, the correction, at the index level, is roughly in line with history in terms of magnitude and duration.

As a reminder, here is what history looks like in terms of the frequency of various levels of market declines, along with the average length of time it takes to recoup the losses:
| Drawdown Threshold | Historical Frequency | Typical # Per Year | Typical Recovery Time |
| 2% | Often | 15 | 1 to 4 Weeks |
| 3% | Once per Month | 11 | 2 to 6 Weeks |
| 5% | Once per Quarter | 4 | 2 to 3 Months |
| 10% | Once per Year | 1 | 8 Months |
| 20% | Once per Market Cycle | 0 | 20 Months |
Source: JP Morgan
He chose, poorly.
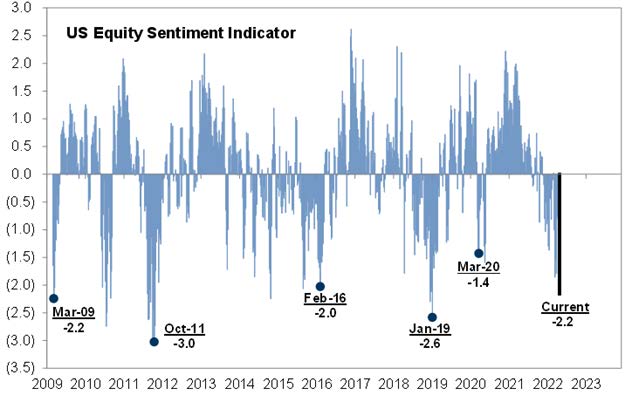
Investors often choose poorly, at least in terms of timing. Extremes in sentiment (on both sides) normally indicate excessive enthusiasm or, as we see now, pessimism. The last times we have been near these levels of pessimism have sometimes marked turning points. As a reminder, here were the other key events:
- March 2020 – Covid lockdowns
- January 2019 – Fed tightening
- February 2016 – Fed tightening, yuan devaluation, Brexit fears
- October 2011 – U.S. government bond downgrade
- March 2009 – Financial crisis
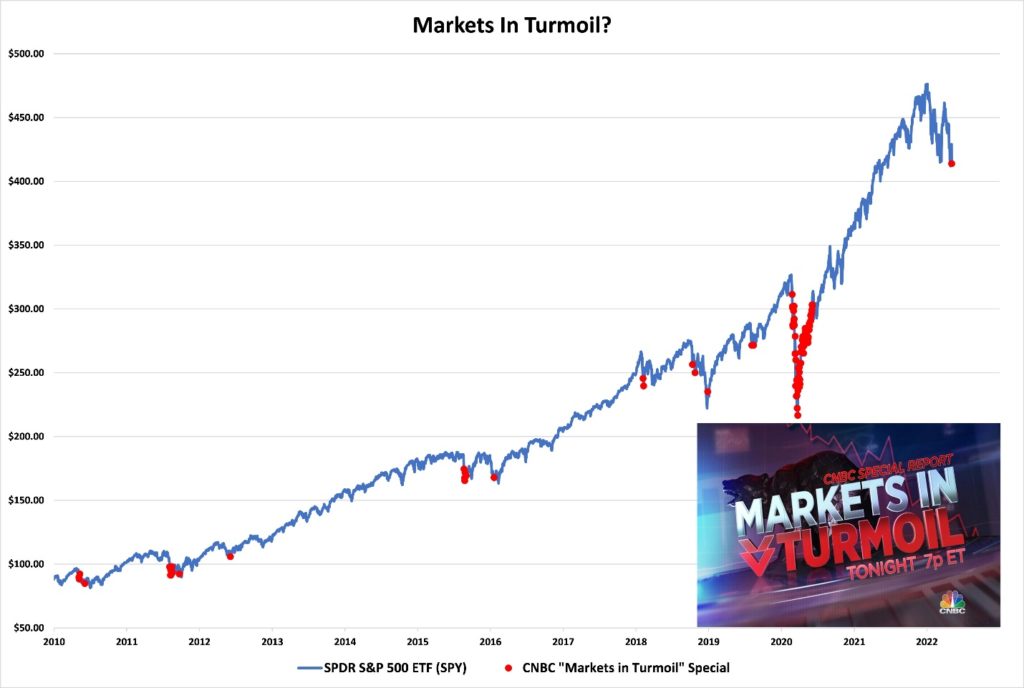
These types of hyperbolic pronouncements from CNBC have often indicated market points of maximum pessimism, though it is important to note CNBC only began this specific brand of fearmongering starting in 2010, i.e., a 12-year run that has not seen an extended bear market. This advertisement was posted on May 5th.
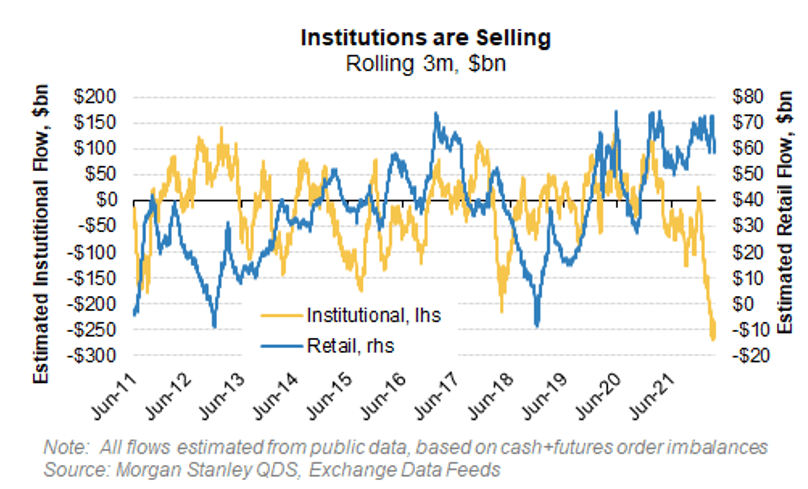
A significant difference we see this time is that sentiment is divergent between institutions and retail investors, who continue to buy almost every dip while institutions are selling:
You lost today, kid. But that doesn’t mean you have to like it.
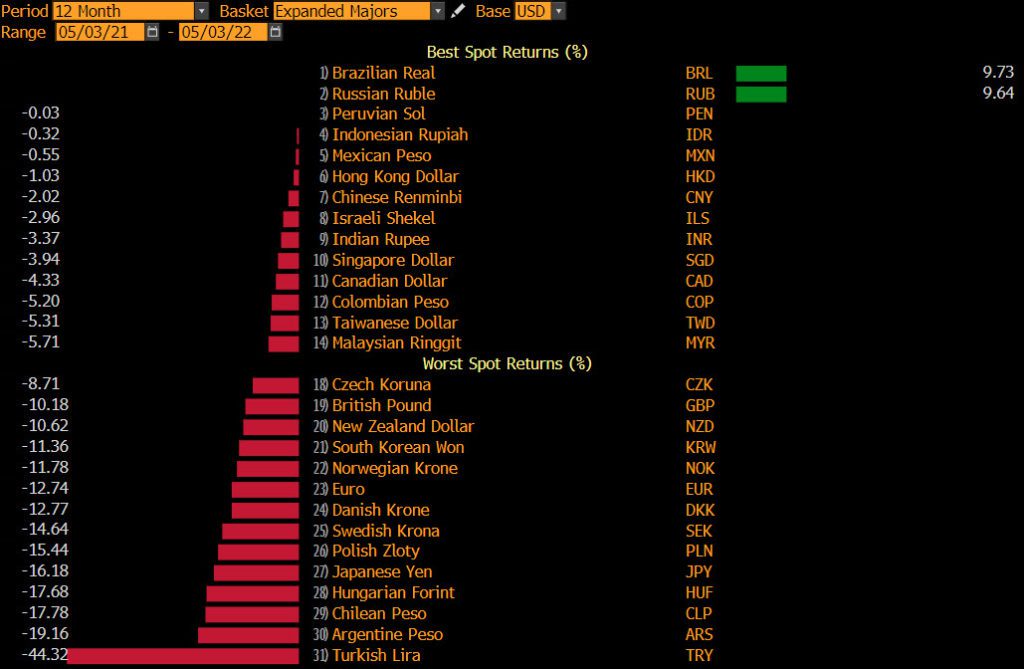
Most investors do not appreciate how impactful currency movements are—they affect inflation, commodity prices, and earnings for multinational corporations in meaningful ways. When currencies are volatile, volatility normally surfaces elsewhere, too.
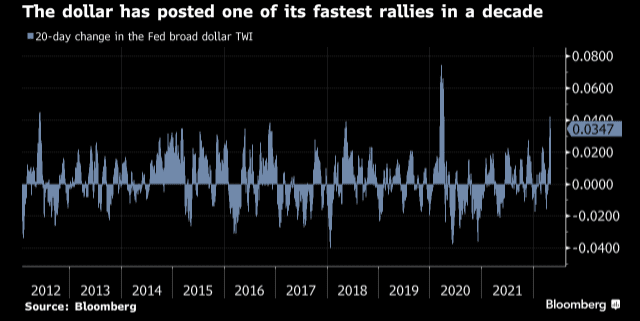
The volatility we have seen in the dollar this year has been nothing short of astounding. The recent rally has been one of the most severe in decades:
In fact, over the last year, every major currency, save two (2), have lost against the dollar. One of these, shockingly, is the Russian Ruble; the other, the Brazilian Real.
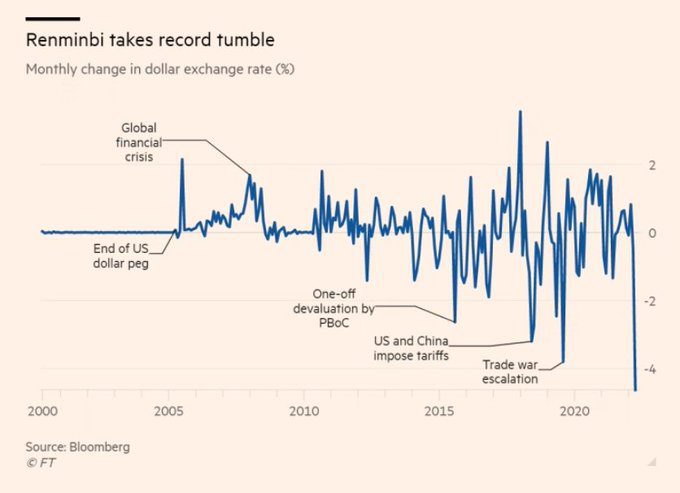
A noteworthy recent decliner is China’s renminbi, which fell more in the past month that it did during the devaluation in 2015:
Please, sit down before you fall down
Broad indices certainly took a seat in April. Our hope is that they do not fall down. Over the last year, only large cap stocks are flat, though the megacap tech name, i.e., the NASDAQ, that heretofore had been the market’s Atlas have started to shrug.
| Index | 1-Month | 3-Month | YTD | 1-Year |
| S&P 500 INDEX | -8.72 | -8.17 | -12.92 | 0.20 |
| Invesco S&P 500 Equal Weight E | -6.51 | -4.87 | -9.02 | 0.80 |
| NASDAQ Composite Index | -13.24 | -13.22 | -21.00 | -11.05 |
| Russell 2000 Index | -9.91 | -7.82 | -16.70 | -16.90 |
| MSCI EAFE Index | -6.40 | -7.32 | -11.79 | -7.64 |
| MSCI Emerging Markets Index | -5.55 | -10.43 | -12.13 | -18.09 |
| Bloomberg US Agg Total Return | -3.79 | -7.51 | -9.50 | -8.51 |
| Bloomberg US Treasury Total Re | -3.10 | -6.73 | -8.50 | -7.35 |
Source: Bloomberg (as of most recent month end)
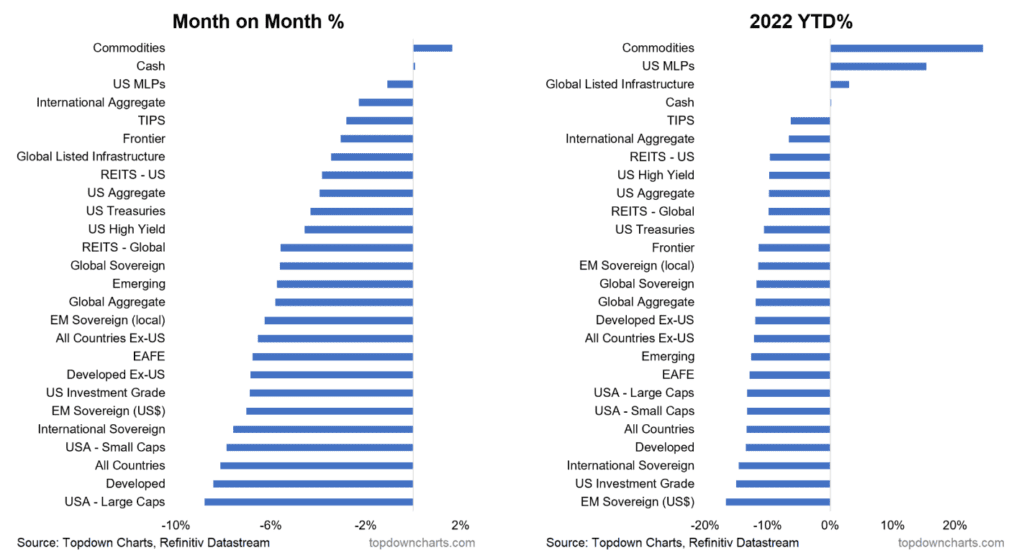
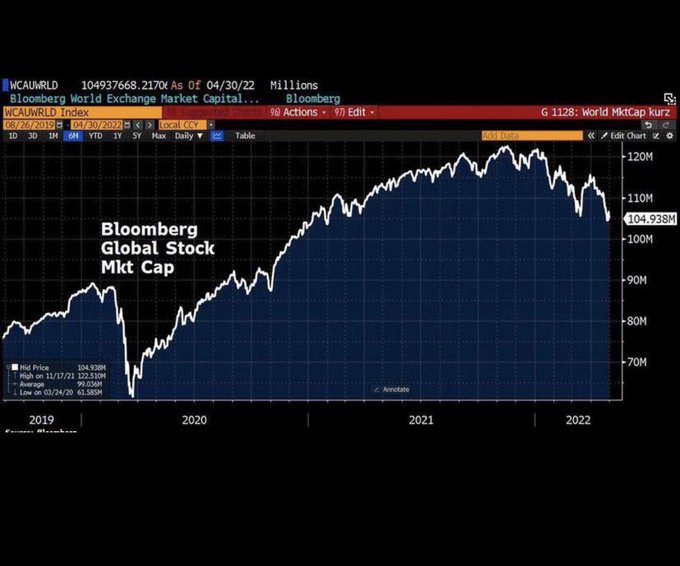
Year to date, there has been nowhere to hide, and the damage to global equities has been severe. In terms of asset classes, commodities were the only thing positive in April:
We have top men working on it now.” “…Who?” “…Top… men.
One of the ironies of Indiana Jones is that, arguably, his quest for the ark was all for naught, and it would have ended up lost to the ages regardless. Having said that, this line remains a personal favorite, and somewhat describes our sentiment with regard to the Fed.
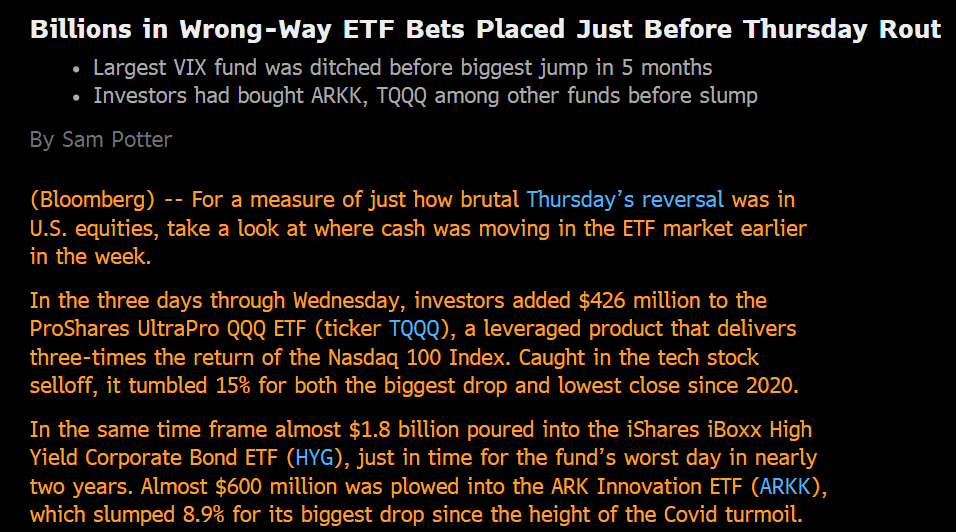
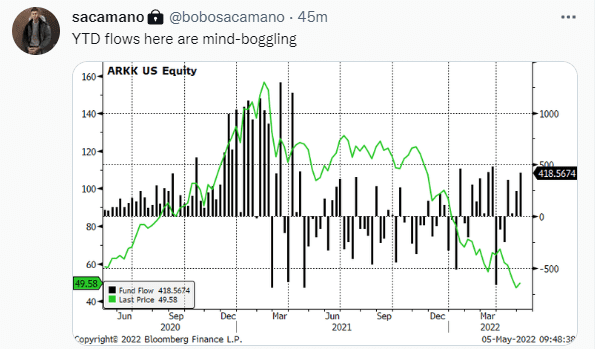
The market’s initial reaction to the Fed’s 50 basis point rate rise, coupled with removing the notion of 75 bps in June, was nothing less than ebullient, i.e., investors were convinced top men were on the job. Junk bond credit spreads tightened by 25 bps…in an hour. The dollar declined, real yields fell. Then, the next day, everything reversed as investors focused on the overall hawkish tone of Powell’s comments. Ultimately, the Fed minutes and press conference led to a decline in equities, higher credit spreads, and higher interest rates. Speculators who chased the market “rip” higher suffered the very next day. A poster child for retail speculation is ARK’s Growth ETF (ARKK), which had sizable flows on the day of the Fed meeting.
Can Powell and his top men (and women) be able to make good on his expectations that, “I think we have a good chance to have a soft or softish landing or outcome, if you will, I’ll give a couple of reasons for that. One is households and businesses are in very strong financial shape.”? Put us in the camp placing low odds on the softish outcome.
As Indy states, X never marks the spot, though, ironically, later in the film it does. Unfortunately, there is no investment version of a treasure map, showing you exaclty where to go and what the ultimate outcomes of any strategy are. As Will stated, this market is as tough as any we have faced. What are we doing?
One, focusing on what we can control. If you harken back to our prior missives, we group sources of return (for equities) into three categories: dividend yield, growth, and multiples. This year, dividends, as always, are positive. EPS growth has been good to quite good. The issue? Multiples, i.e., P/E. Those have contracted meaningfully this year, particularly in April.
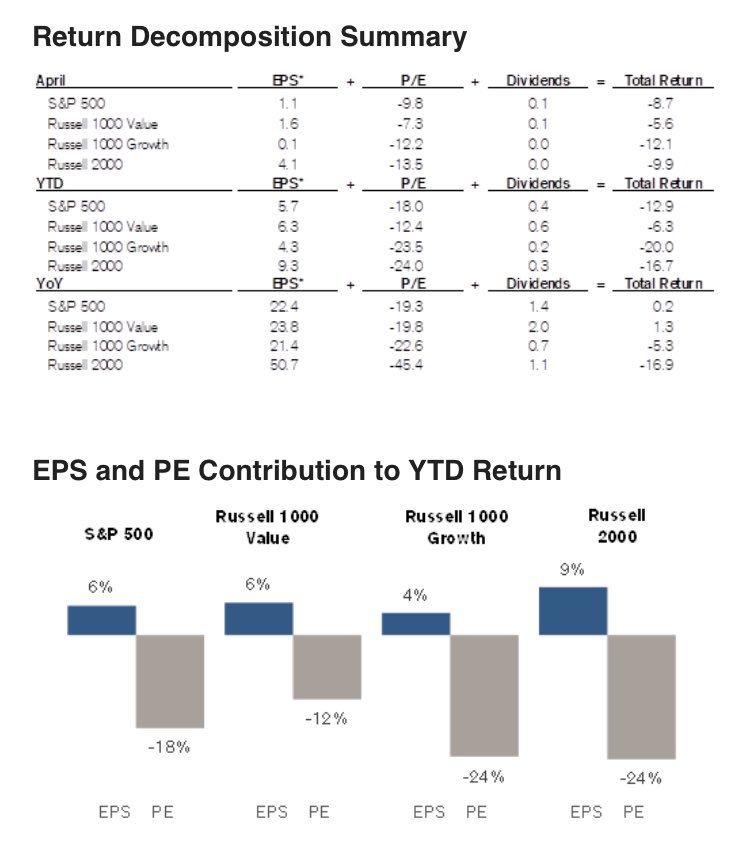
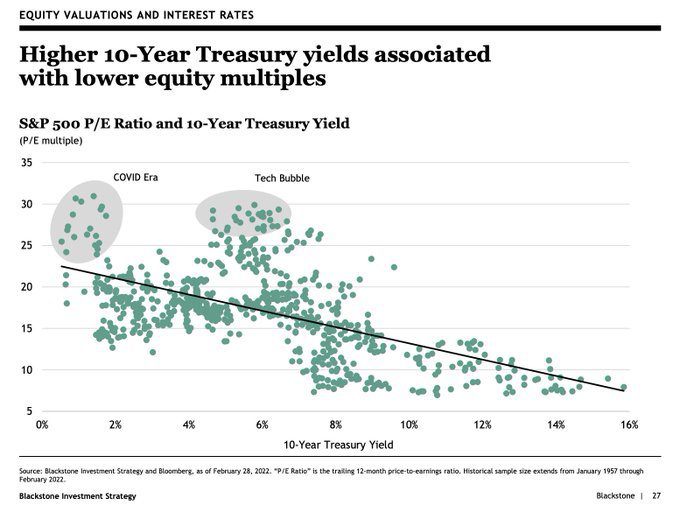
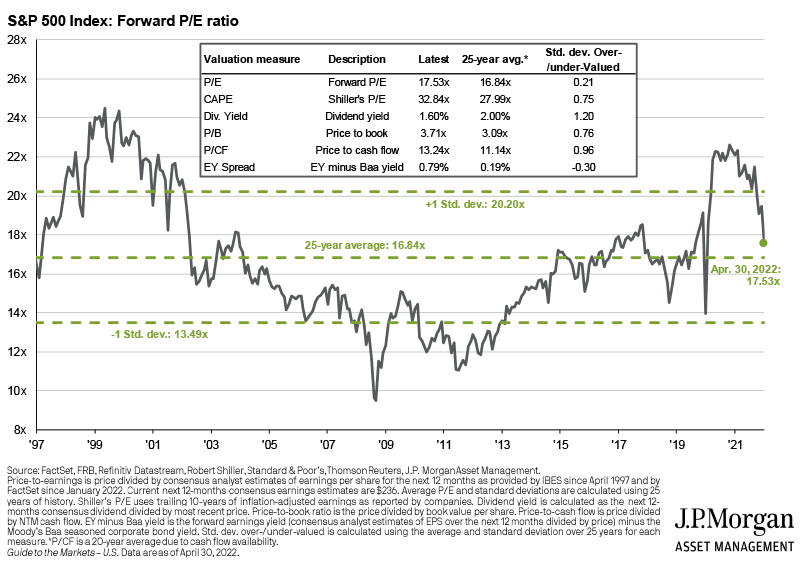
The reason? The Fed has succeeded in moving the 10-year Treasury out of the doldrums and into the 3% range, where multiples are normally less stratospheric than where they have been trading. We can see the multiple for the index, on a P/E basis, is now more in-line with historical averages as well as where it should be at a 3% yiekd on the 10-year Treasury.
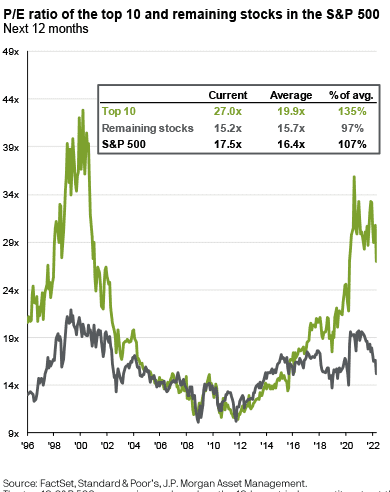
One, invest away from the index, i.e., not be myopically focused on indices comprised of large, U.S. stocks, which continue to be top-heavy and expensive, especially at the top:
Second, utilize investments that employ hedges. Third, in terms of individual equities, we emphasize, ceteris paribus, higher yields and lower valuations. In other words, we are trying to avoid suffering from the magnitude of multiple contraction we are seeing among the more highly valued segments of the market.
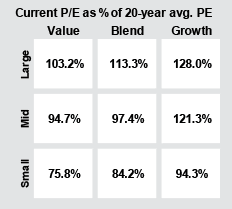
We recently sifted through the wreckage of the large growth space, and found that, despite signifcant drawdowns, most of these companies remain expensive on both an absolute and relative basis. In other words, we are finding more value in value and smaller names:
In keeping with the spirit of the trilogy (I know there were other movies; I just refuse to ackowledge them), there is no Holy Grail of investing. However, we are taking step to navigate this challenging environment as best we can to protect capital while not taking on the mantle of a permabear. As investors, we must choose, but choose wisely.

READY TO TALK?