

February Update: Year of the Tiger
There are two things we cannot ignore in this month’s recap. One, the historically dreadful January we have seen in stocks. Second, though, is the tremendous run the Cincinnati Bengals have made. Given that today (February 1) marks the beginning of the Lunar New Year and begins the Year of the Tiger, perhaps a fortuitous portent for the orange and black.
Year of the Ox
The year just ended (from a lunar perspective) was that of the ox which, to use a little creative license, is like a bull. Entering January, U.S. equities, at least from an index perspective, were in bull market territory, though as discussed in our last update, the index strength was masking underlying weakness.
What we witnessed in January was a case where the relevant market indices began to show cracks in the façade, though the damage cascaded to individual stocks as well. If not for a ferocious rebound at the tail end of the month, January 2022 would have ranked as a Kenny Bania-esque absolute worst January ever.
By its conclusion, the S&P had its worst January since 2009, while the NASDAQ had its worst start since 2008. Small caps were on pace for their worst January ever, though ended with their worst since 2016 and briefly entered a bear market, defined as 20% below the high.
Year of the Tiger
Beginning in a few days are the Winter Olympics in Beijing. In an era of strained relationships between China and the U.S, China’s ambassador stated he hoped athletes and observers “feel its TIGER feature, which means Tense, Inclusive, Green, Extraordinary and Refreshing.” We will use this framework as we look back on January and ahead to the rest of the year of the tiger.
Tense
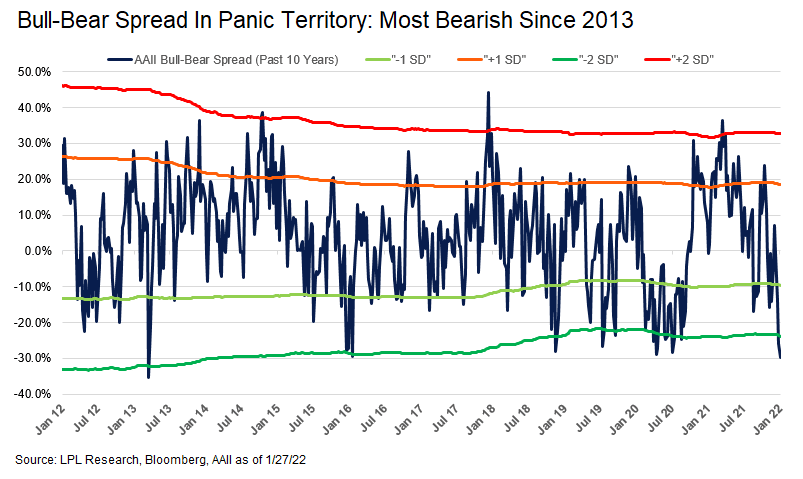
The result of this market carnage plunged some indicators of market sentiment into panic territory, meaning investors are tense. That this drawdown exceeded the levels of panic seen at the outset of the Covid pandemic is shocking.
Inclusive
One thing the bull market has not been is inclusive. Before moving on to the reasons for the drawdown, let us look at research we did that puts a finer point on the divergence between the performance of the three main U.S. indices we track (S&P 500, NASDAQ, and Russell 2000) versus the stocks that compose these indices.
Here, we look at the drawdown for each index, i.e., how far it has fallen from its 52-week high, versus the average stock in each index.
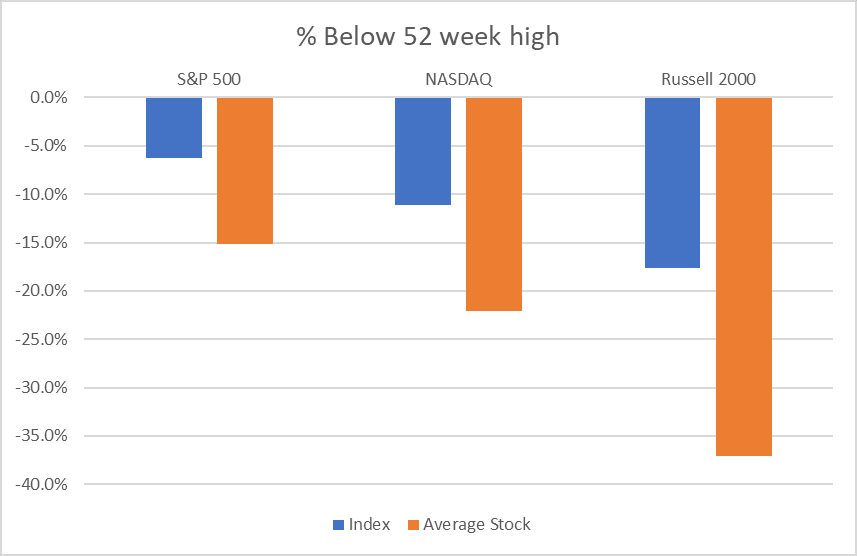
Even after a volatile January, the S&P index is a mere 5% below its all-time highs. The NASDAQ index resides in correction territory, down a bit more than 10%, while small caps are down almost 20%. However, the average S&P 500 stock is down nearly three times as much as the index (-15%), the average NASDAQ stock is in a correction, and the average Russell 2000 stock has suffered a 35% decline.
So, has this been a stock pickers’ market? Not even close. Even those of us who have been doing this professionally for decades struggle to overcome the odds when the percentage of stocks outperforming within the index are stacked like this:
- S&P 500 – 21%
- NASDAQ – 20%
- Russell 2000 – 28%
Green
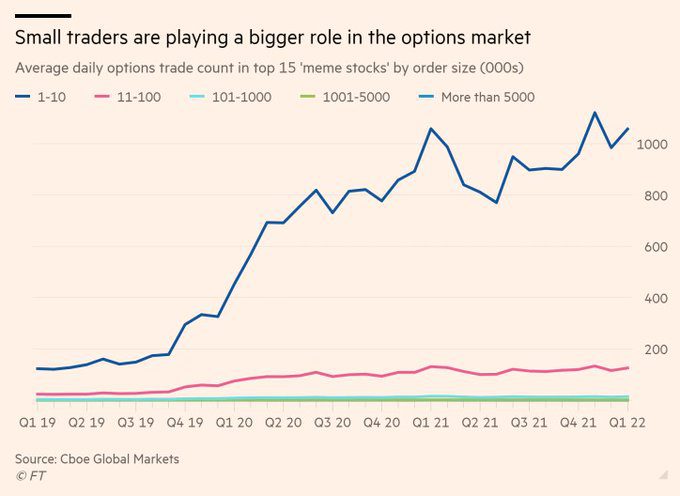
One reason for this divergence? Options trading by green, i.e., retail, investors. Despite the market carnage, retail speculation, though slightly below its highest levels continues unabated:
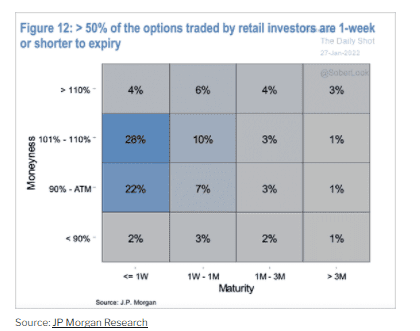
Moreover, recent, albeit blurry, data from J.P. Morgan shows it is even worse than we thought, with over half of options traded by retail at one week (or shorter) expiry. This is gambling, plain and simple, and because of how options are hedged, has an outsized impact on certain names.
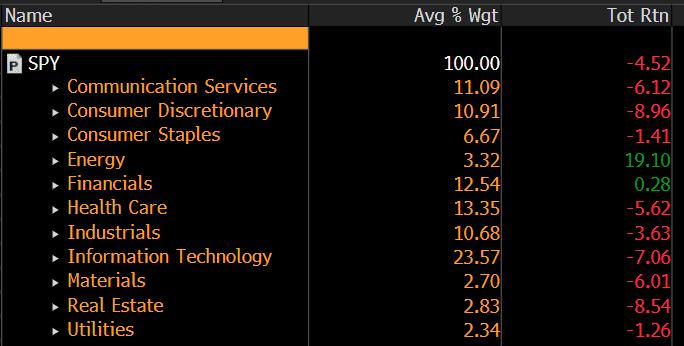
We could also look at green ironically, and note that the most non-green sector, i.e., energy, was by far the best performer in January. Nine of eleven sectors declined, with energy generating the only meaningfully positive return, but at an index weight of a mere 3%, it was unable to provide much of a contribution to the index, which remains dominated by technology.
Extraordinary
The response by the Fed to the Covid pandemic has been extraordinary. Rates slashed to zero while its balance sheet ballooned to $9 trillion.
However, this extraordinary accommodation is ending, if one is to believe the change in tenor from the Fed. The pivot in early January expressed by Fed chair Jerome Powell served to markedly shift market sentiment, with his comments perceived as considerably more hawkish and serious as it relates to the Fed putting a damper on inflation.
Within the Chinese zodiac, there is a year of the rooster, and we get the sense the Fed is playing a dangerous game of chicken. (For those who need clarification on the differences between chickens and roosters, click here).
The concern over inflation is real. For evidence look no further than a 7% CPI print for December 2021, double-digit increases in export and import prices, and wage growth more than 10% for younger workers.
Why are we seeing such elevated reading? To quote Milton Friedman, “inflation is caused by too much money chasing after too few goods.” The creator of the “too much money” part of the equation is the Federal Reserve, with an assist from Washington, D.C.’s fiscal stimulus. For reference, the Fed increased the size of its balance sheet from $4 trillion as of 12/31/2019 (pre-Covid) to almost $9 trillion by 12/31/21.
The “too few goods” is relevant as well, given structural issues, e.g., supply chains, & employee shortages have contributed to inflation.
The irony is that the creator is now tasked with bringing rampaging inflation under control. Can it be done?
There are two tools at the Fed’s disposal:
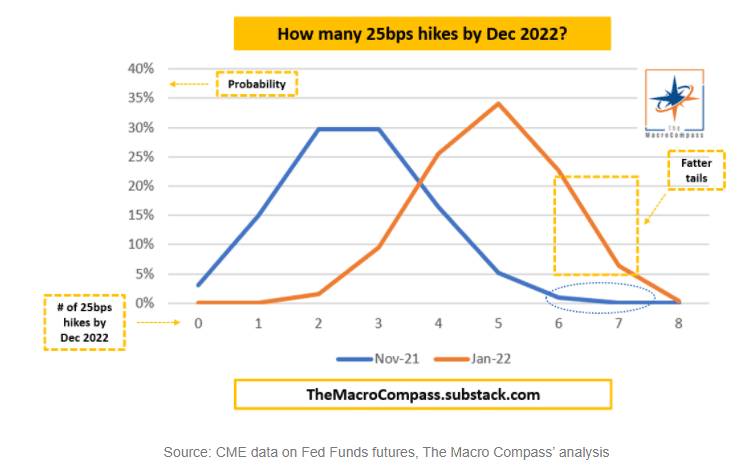
- Interest rates. The Fed can increase its short-term borrowing rates, which it cut to from 1.55% to, effectively, 0%, in early 2020 . The market is currently pricing over five hikes in 2022, though J.P. Morgan’s CEO Jamie Dimon mentioned the possibility of even more.
- Quantitative tightening. As opposed to the quantitative easing, i.e., bond buying, we have seen since the pandemic began, the Fed can stop buying bonds and allow those on its balance sheet to mature.
So, these tools can help fix the first part of the inflation equation (“too much money”), but not the second “too few goods.” On the latter, one thing being given short shrift is higher energy prices, which are an incredibly powerful transfer mechanism for inflation, and are exacerbated by government unfriendly policies on fossil fuels.
What are the consequences of taming inflation?
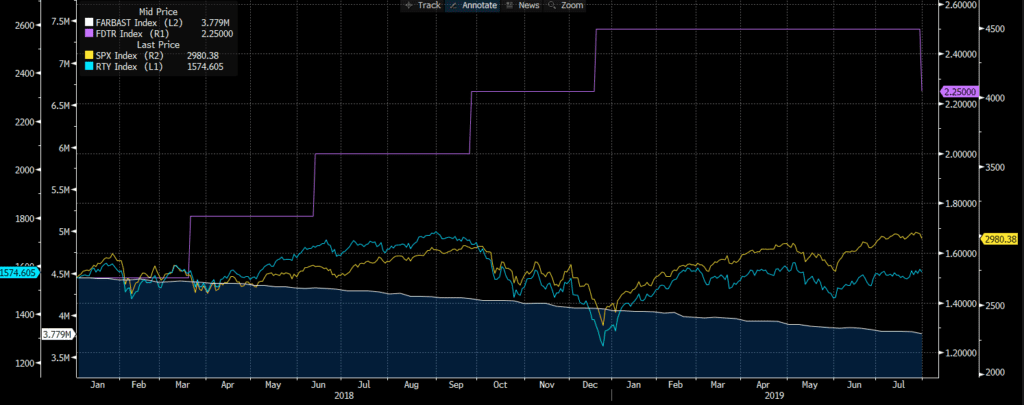
The Fed’s balance sheet has grown almost 9-fold since the Great Financial Crisis. There has been only one meaningful effort at a return to normalcy, which began in earnest 2018, when the Fed both increased short-term borrowing rates (purple line, from 1.4% to 2.4%) and shrunk its balance sheet (white line, from $4.5 trillion to $3.8 trillion, a 15% reduction).
The Fed’s efforts at normalization ended in July 2019 with a cut in short-term rates. For the entirety of the period, we can see the S&P 500 (yellow line) posted a modest gain while the Russell 2000 (blue line) was flat. However, volatility was heightened, punctuated by a bear market in the latter half of 2018.
Why might this time be different?
- Inflation itself. The prior effort at normalization came when inflation was tame (between 2% and 3%). Although the 7% headline number may mathematically be difficult to maintain, continued above-average readings may compel more aggressive action.
- Politics. Despite the Fed’s avowed inability to be swayed by political factors, the tightening in 2018 was met with disdain by President Trump. Conversely, President Biden, at a press conference on 1/19/22, stated, “Given the strength of our economy and pace of recent price increases, it’s appropriate — as Fed Chairman Powell has indicated — to recalibrate the support that is now necessary.”
- Valuations. The current forward P/E of the S&P 500 is approximately 21x and reflects historically high profit margins (12%). The forward P/E entering the last tightening cycle was around 18x, with approximately average profit margins (8%). With the last few drawdowns nadiring in the 13-14x range, there is more potential downside today.
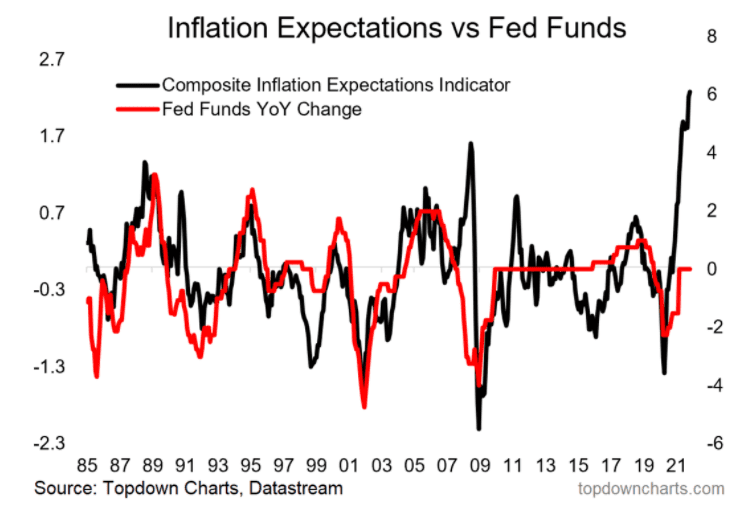
The Fed may very well cause significant harm to itself and/or the markets if it miscalculates in this game of chicken. Too aggressive? Economic growth weakens significantly. Not aggressive enough? The Fed loses credibility and inflation expectations soar.
Mathematically, it is likely that inflation will cool significantly during 2022, given the base effects associated with its calculations. Is it enough to get inflation below the Fed’s desired level? Perhaps, though organically declining inflation coupled with monetary tightening could be, in fact, deflationary.
Refreshing
Admittedly, it is far down the list in terms of how refreshing is defined, but it could be argued that investors have refreshed expectations considering the changes with regard to inflation (higher), the Fed (hawkish), and equities (falling).
One thing we have not discussed are bonds. Historically, in an environment, when equities are down sharply, bonds have provided a boost. Though a relative outperformer in January, bonds still suffered declines as interest rates rose due to the Fed hawkishness.
Over the last 12 months, U.S. large cap stocks have been almost the only source of meaningful returns. Non-U.S. stocks posted modest returns if looking at developed markets while emerging market stocks declined 7%. Likewise, U.S. small cap stocks, even at the index level, have done little over the last year.
| Index | 1-Month | 3-Month | 1-Year |
| S&P 500 INDEX | -5.17 | -1.62 | 23.27 |
| Invesco S&P 500 Equal Weight E | -4.37 | -1.05 | 24.78 |
| NASDAQ Composite Index | -8.96 | -7.96 | 9.68 |
| Russell 2000 Index | -9.63 | -11.48 | -1.24 |
| MSCI EAFE Index | -4.82 | -4.57 | 7.60 |
| MSCI Emerging Markets Index | -1.90 | -4.11 | -7.02 |
| Bloomberg US Agg Total Return | -2.15 | -2.12 | -2.97 |
| Bloomberg US Treasury Total Re | -1.89 | -1.65 | -3.25 |
Source: Bloomberg (as of most recent month end)
I’ve Got a Tiger by the Tail
Investors and the Fed probably feel this way now. As we wrote last month:
- The average intrayear drop for the S&P since 1980, an era dominated by declining interest rates, has been 14%.
- It is our opinion that the NASDAQ will correct somewhere between 14 to 25% in the next 6 to 9 months.
It took less than a month to get within a shout of the average S&P drawdown, and the NASDAQ decline hit the top end of our range. The ferocity of the market moves against the backdrop of Fed tightening and elevated valuations should not be ignored.
Markets are pricing a 2010’s style regime, with low short rates and low inflation, i.e., the Fed succesfully playing the game of chicken. As Bridgewater states, “Despite this uniquely interesting and potentially volatile set of unfolding conditions, the markets are discounting neither a significant tightening nor higher inflation. In other words, current pricing suggests that the overall stance of policy will remain extremely easy indefinitely into an already hot economy, culminating in stable nominal rates between 0% and 2% and permanently negative real rates, both in the US and throughout the developed world.”
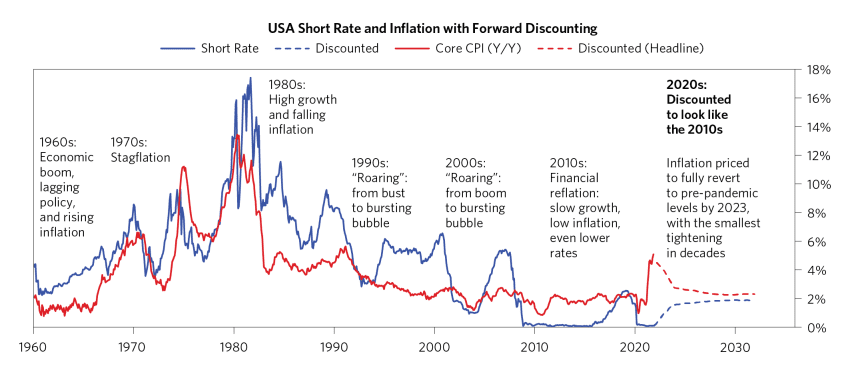
Source: Bridgewater
We tend to view the consensus as wrong here, as Covid’s long-term impact on things like the labor force and supply chains may prove a seachange in terms of inflation, which has second-order effects on monetary policy. Moreover, we would argue in its playoff game against inflation, the Fed is down 18 at halftime, and Joe Burrow is not setting monetary policy.
The downturn we have seen at the individual stock level is affording us opportunites we believe will be rewarded over the long term, though investors should be mindful of the top-down challenges macroeconomic events, not to mention heightened geopolitical tensions and pandemic-related shocks, may present during what we hope is, indeed, the year of the (Bengal) tiger.
Who Dey.
READY TO TALK?